Maltese vs Finnish Median Earnings
COMPARE
Maltese
Finnish
Median Earnings
Median Earnings Comparison
Maltese
Finns
$52,526
MEDIAN EARNINGS
100.0/ 100
METRIC RATING
42nd/ 347
METRIC RANK
$45,940
MEDIAN EARNINGS
33.4/ 100
METRIC RATING
191st/ 347
METRIC RANK
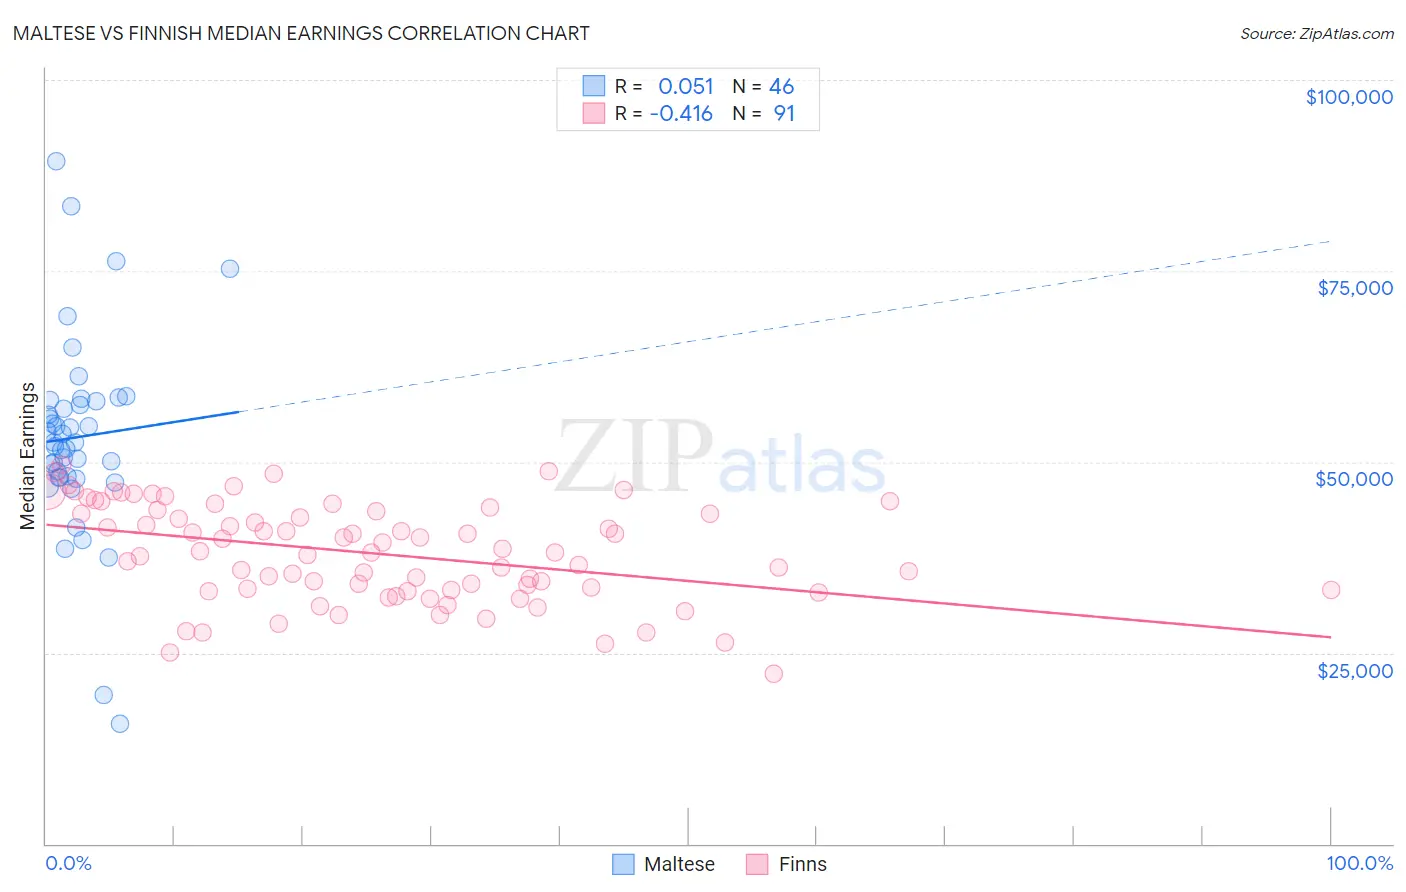
Maltese vs Finnish Median Earnings Correlation Chart
The statistical analysis conducted on geographies consisting of 126,475,400 people shows a slight positive correlation between the proportion of Maltese and median earnings in the United States with a correlation coefficient (R) of 0.051 and weighted average of $52,526. Similarly, the statistical analysis conducted on geographies consisting of 404,629,884 people shows a moderate negative correlation between the proportion of Finns and median earnings in the United States with a correlation coefficient (R) of -0.416 and weighted average of $45,940, a difference of 14.3%.
Median Earnings Correlation Summary
| Measurement | Maltese | Finnish |
| Minimum | $15,781 | $22,232 |
| Maximum | $89,336 | $49,637 |
| Range | $73,555 | $27,405 |
| Mean | $53,240 | $38,029 |
| Median | $52,561 | $38,169 |
| Interquartile 25% (IQ1) | $48,020 | $33,167 |
| Interquartile 75% (IQ3) | $57,908 | $43,485 |
| Interquartile Range (IQR) | $9,888 | $10,318 |
| Standard Deviation (Sample) | $12,910 | $6,403 |
| Standard Deviation (Population) | $12,769 | $6,368 |
Similar Demographics by Median Earnings
Demographics Similar to Maltese by Median Earnings
In terms of median earnings, the demographic groups most similar to Maltese are Immigrants from Malaysia ($52,514, a difference of 0.020%), Bulgarian ($52,512, a difference of 0.030%), Immigrants from Czechoslovakia ($52,361, a difference of 0.31%), Bhutanese ($52,297, a difference of 0.44%), and Australian ($52,294, a difference of 0.44%).
| Demographics | Rating | Rank | Median Earnings |
| Immigrants | Switzerland | 100.0 /100 | #35 | Exceptional $53,211 |
| Immigrants | Denmark | 100.0 /100 | #36 | Exceptional $53,186 |
| Immigrants | Belarus | 100.0 /100 | #37 | Exceptional $53,043 |
| Latvians | 100.0 /100 | #38 | Exceptional $53,001 |
| Immigrants | Turkey | 100.0 /100 | #39 | Exceptional $52,960 |
| Israelis | 100.0 /100 | #40 | Exceptional $52,937 |
| Immigrants | Lithuania | 100.0 /100 | #41 | Exceptional $52,769 |
| Maltese | 100.0 /100 | #42 | Exceptional $52,526 |
| Immigrants | Malaysia | 100.0 /100 | #43 | Exceptional $52,514 |
| Bulgarians | 100.0 /100 | #44 | Exceptional $52,512 |
| Immigrants | Czechoslovakia | 100.0 /100 | #45 | Exceptional $52,361 |
| Bhutanese | 100.0 /100 | #46 | Exceptional $52,297 |
| Australians | 100.0 /100 | #47 | Exceptional $52,294 |
| Immigrants | Europe | 100.0 /100 | #48 | Exceptional $52,195 |
| Bolivians | 100.0 /100 | #49 | Exceptional $52,005 |
Demographics Similar to Finns by Median Earnings
In terms of median earnings, the demographic groups most similar to Finns are German ($45,935, a difference of 0.010%), Guamanian/Chamorro ($45,933, a difference of 0.010%), Immigrants from Costa Rica ($45,928, a difference of 0.030%), Immigrants from St. Vincent and the Grenadines ($45,908, a difference of 0.070%), and French Canadian ($46,026, a difference of 0.19%).
| Demographics | Rating | Rank | Median Earnings |
| Immigrants | Kenya | 42.4 /100 | #184 | Average $46,214 |
| Uruguayans | 41.6 /100 | #185 | Average $46,190 |
| Vietnamese | 40.9 /100 | #186 | Average $46,172 |
| Iraqis | 39.9 /100 | #187 | Fair $46,140 |
| Immigrants | Armenia | 38.3 /100 | #188 | Fair $46,094 |
| Spaniards | 37.2 /100 | #189 | Fair $46,059 |
| French Canadians | 36.1 /100 | #190 | Fair $46,026 |
| Finns | 33.4 /100 | #191 | Fair $45,940 |
| Germans | 33.2 /100 | #192 | Fair $45,935 |
| Guamanians/Chamorros | 33.2 /100 | #193 | Fair $45,933 |
| Immigrants | Costa Rica | 33.0 /100 | #194 | Fair $45,928 |
| Immigrants | St. Vincent and the Grenadines | 32.4 /100 | #195 | Fair $45,908 |
| Yugoslavians | 30.5 /100 | #196 | Fair $45,846 |
| Barbadians | 30.5 /100 | #197 | Fair $45,846 |
| Trinidadians and Tobagonians | 29.7 /100 | #198 | Fair $45,820 |