Belizean vs Celtic Median Family Income
COMPARE
Belizean
Celtic
Median Family Income
Median Family Income Comparison
Belizeans
Celtics
$90,880
MEDIAN FAMILY INCOME
0.2/ 100
METRIC RATING
269th/ 347
METRIC RANK
$101,139
MEDIAN FAMILY INCOME
31.3/ 100
METRIC RATING
186th/ 347
METRIC RANK
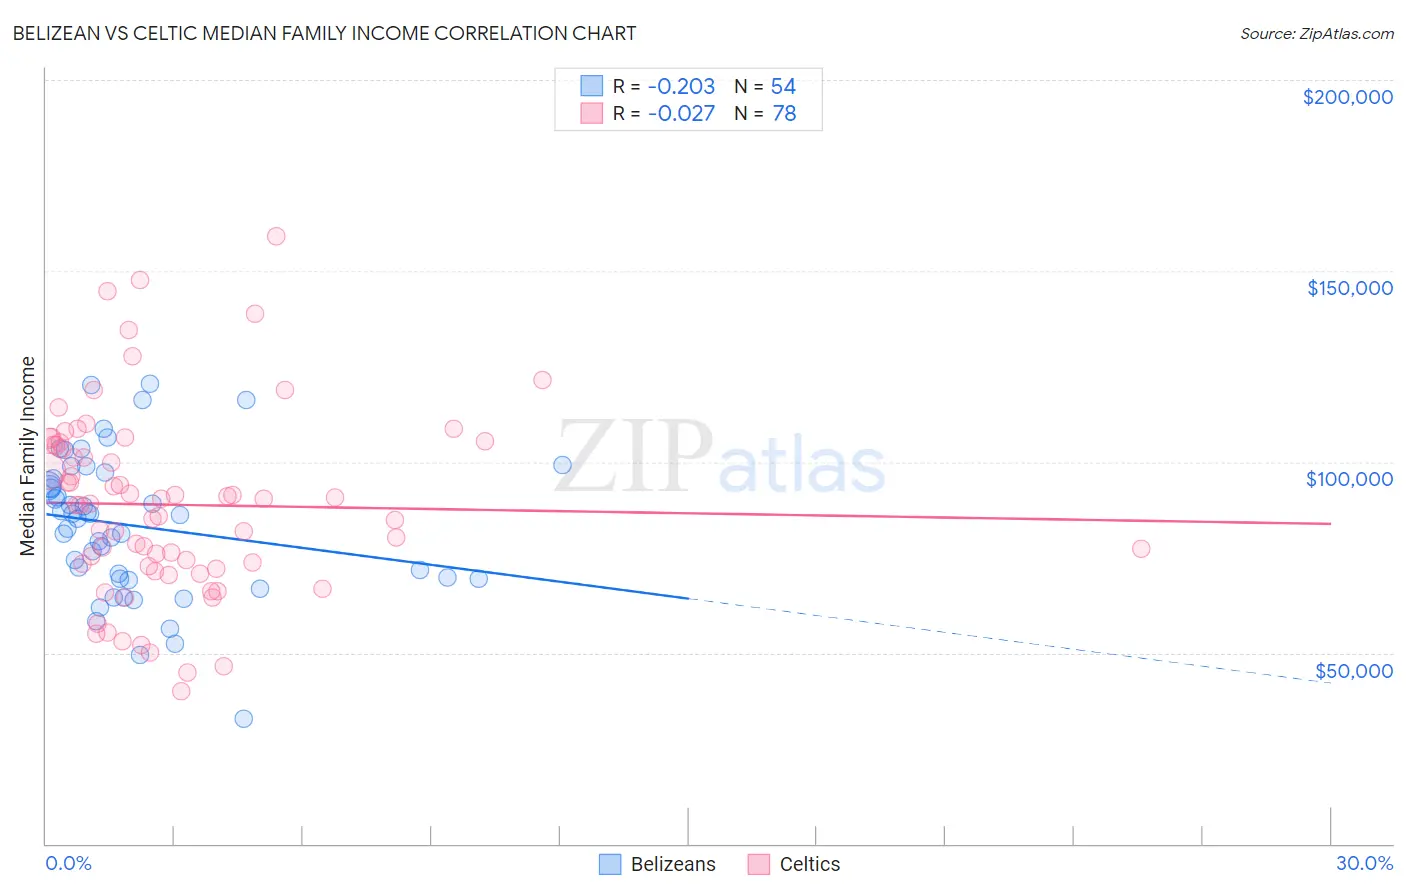
Belizean vs Celtic Median Family Income Correlation Chart
The statistical analysis conducted on geographies consisting of 144,140,604 people shows a weak negative correlation between the proportion of Belizeans and median family income in the United States with a correlation coefficient (R) of -0.203 and weighted average of $90,880. Similarly, the statistical analysis conducted on geographies consisting of 168,835,112 people shows no correlation between the proportion of Celtics and median family income in the United States with a correlation coefficient (R) of -0.027 and weighted average of $101,139, a difference of 11.3%.
Median Family Income Correlation Summary
| Measurement | Belizean | Celtic |
| Minimum | $32,813 | $39,850 |
| Maximum | $120,348 | $159,107 |
| Range | $87,535 | $119,257 |
| Mean | $83,217 | $88,779 |
| Median | $85,583 | $88,800 |
| Interquartile 25% (IQ1) | $69,412 | $72,704 |
| Interquartile 75% (IQ3) | $95,563 | $104,459 |
| Interquartile Range (IQR) | $26,151 | $31,755 |
| Standard Deviation (Sample) | $18,683 | $24,372 |
| Standard Deviation (Population) | $18,509 | $24,216 |
Similar Demographics by Median Family Income
Demographics Similar to Belizeans by Median Family Income
In terms of median family income, the demographic groups most similar to Belizeans are Cree ($90,882, a difference of 0.0%), Mexican American Indian ($90,918, a difference of 0.040%), Central American ($91,087, a difference of 0.23%), Jamaican ($90,581, a difference of 0.33%), and Iroquois ($90,543, a difference of 0.37%).
| Demographics | Rating | Rank | Median Family Income |
| Liberians | 0.4 /100 | #262 | Tragic $91,722 |
| Immigrants | West Indies | 0.3 /100 | #263 | Tragic $91,588 |
| Senegalese | 0.3 /100 | #264 | Tragic $91,475 |
| Hmong | 0.3 /100 | #265 | Tragic $91,296 |
| Central Americans | 0.3 /100 | #266 | Tragic $91,087 |
| Mexican American Indians | 0.2 /100 | #267 | Tragic $90,918 |
| Cree | 0.2 /100 | #268 | Tragic $90,882 |
| Belizeans | 0.2 /100 | #269 | Tragic $90,880 |
| Jamaicans | 0.2 /100 | #270 | Tragic $90,581 |
| Iroquois | 0.2 /100 | #271 | Tragic $90,543 |
| Immigrants | Liberia | 0.2 /100 | #272 | Tragic $90,450 |
| Immigrants | Micronesia | 0.2 /100 | #273 | Tragic $90,345 |
| Spanish Americans | 0.2 /100 | #274 | Tragic $90,322 |
| Immigrants | St. Vincent and the Grenadines | 0.2 /100 | #275 | Tragic $90,094 |
| Immigrants | Zaire | 0.1 /100 | #276 | Tragic $89,285 |
Demographics Similar to Celtics by Median Family Income
In terms of median family income, the demographic groups most similar to Celtics are Dutch ($101,192, a difference of 0.050%), Tlingit-Haida ($101,092, a difference of 0.050%), Guamanian/Chamorro ($101,061, a difference of 0.080%), Immigrants from Portugal ($100,984, a difference of 0.15%), and Immigrants ($100,962, a difference of 0.18%).
| Demographics | Rating | Rank | Median Family Income |
| South Americans | 39.7 /100 | #179 | Fair $101,856 |
| French Canadians | 37.0 /100 | #180 | Fair $101,634 |
| Spaniards | 36.8 /100 | #181 | Fair $101,617 |
| Tsimshian | 35.9 /100 | #182 | Fair $101,543 |
| Kenyans | 34.5 /100 | #183 | Fair $101,417 |
| Immigrants | Costa Rica | 33.7 /100 | #184 | Fair $101,354 |
| Dutch | 31.9 /100 | #185 | Fair $101,192 |
| Celtics | 31.3 /100 | #186 | Fair $101,139 |
| Tlingit-Haida | 30.8 /100 | #187 | Fair $101,092 |
| Guamanians/Chamorros | 30.5 /100 | #188 | Fair $101,061 |
| Immigrants | Portugal | 29.6 /100 | #189 | Fair $100,984 |
| Immigrants | Immigrants | 29.4 /100 | #190 | Fair $100,962 |
| Colombians | 27.2 /100 | #191 | Fair $100,750 |
| Immigrants | Kenya | 26.5 /100 | #192 | Fair $100,679 |
| Iraqis | 26.3 /100 | #193 | Fair $100,658 |