Immigrants from Northern Africa vs Celtic Median Family Income
COMPARE
Immigrants from Northern Africa
Celtic
Median Family Income
Median Family Income Comparison
Immigrants from Northern Africa
Celtics
$108,161
MEDIAN FAMILY INCOME
94.3/ 100
METRIC RATING
120th/ 347
METRIC RANK
$101,139
MEDIAN FAMILY INCOME
31.3/ 100
METRIC RATING
186th/ 347
METRIC RANK
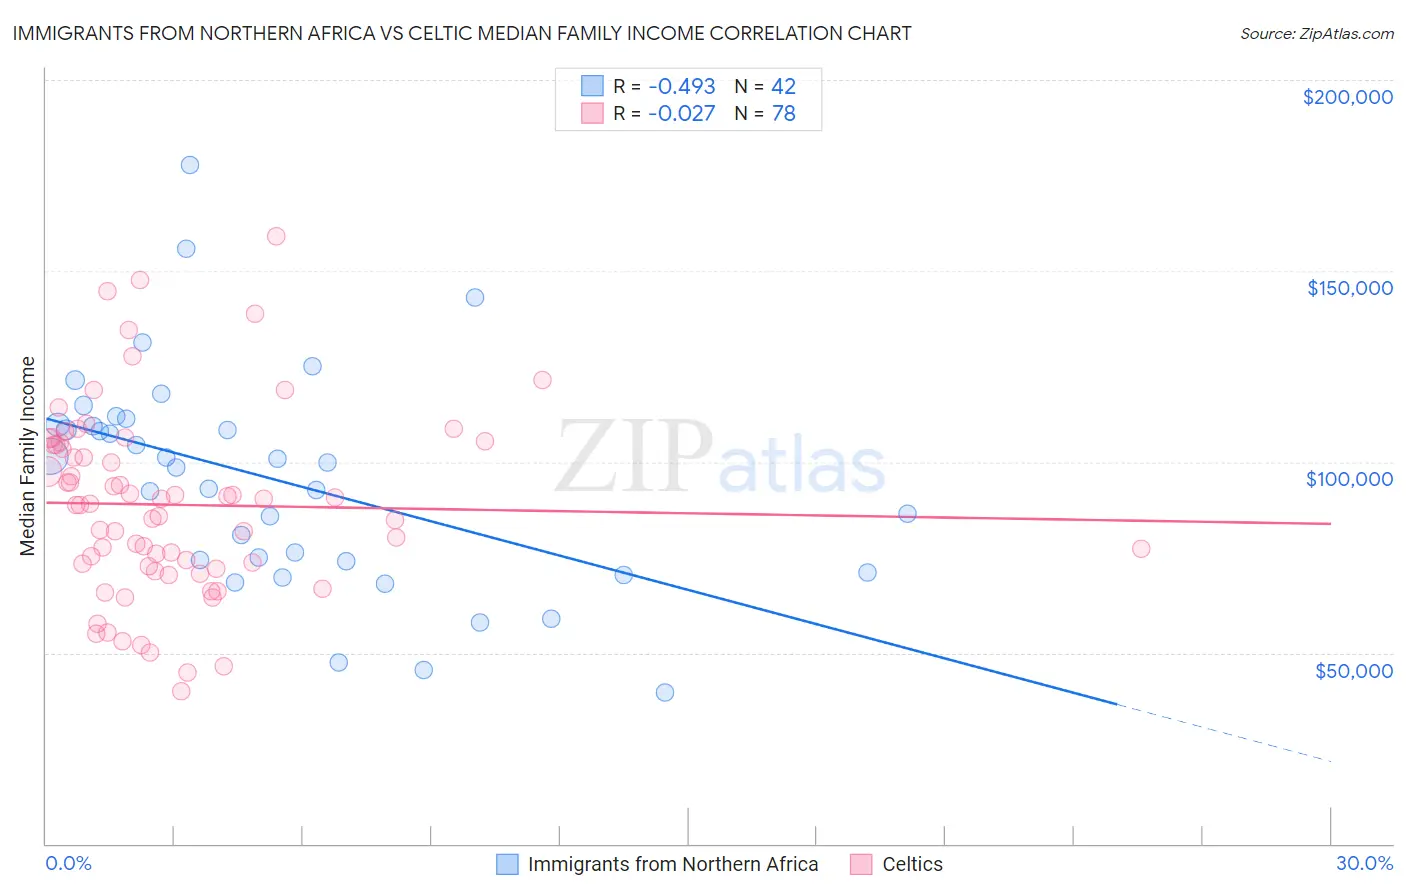
Immigrants from Northern Africa vs Celtic Median Family Income Correlation Chart
The statistical analysis conducted on geographies consisting of 321,028,181 people shows a moderate negative correlation between the proportion of Immigrants from Northern Africa and median family income in the United States with a correlation coefficient (R) of -0.493 and weighted average of $108,161. Similarly, the statistical analysis conducted on geographies consisting of 168,835,112 people shows no correlation between the proportion of Celtics and median family income in the United States with a correlation coefficient (R) of -0.027 and weighted average of $101,139, a difference of 6.9%.
Median Family Income Correlation Summary
| Measurement | Immigrants from Northern Africa | Celtic |
| Minimum | $39,712 | $39,850 |
| Maximum | $177,697 | $159,107 |
| Range | $137,985 | $119,257 |
| Mean | $95,107 | $88,779 |
| Median | $99,249 | $88,800 |
| Interquartile 25% (IQ1) | $74,063 | $72,704 |
| Interquartile 75% (IQ3) | $109,687 | $104,459 |
| Interquartile Range (IQR) | $35,624 | $31,755 |
| Standard Deviation (Sample) | $28,923 | $24,372 |
| Standard Deviation (Population) | $28,576 | $24,216 |
Similar Demographics by Median Family Income
Demographics Similar to Immigrants from Northern Africa by Median Family Income
In terms of median family income, the demographic groups most similar to Immigrants from Northern Africa are European ($108,099, a difference of 0.060%), Sri Lankan ($108,234, a difference of 0.070%), Ethiopian ($108,251, a difference of 0.080%), Immigrants from Philippines ($108,288, a difference of 0.12%), and Chilean ($108,429, a difference of 0.25%).
| Demographics | Rating | Rank | Median Family Income |
| Immigrants | Saudi Arabia | 95.2 /100 | #113 | Exceptional $108,544 |
| Poles | 95.2 /100 | #114 | Exceptional $108,507 |
| Swedes | 95.1 /100 | #115 | Exceptional $108,499 |
| Chileans | 95.0 /100 | #116 | Exceptional $108,429 |
| Immigrants | Philippines | 94.6 /100 | #117 | Exceptional $108,288 |
| Ethiopians | 94.5 /100 | #118 | Exceptional $108,251 |
| Sri Lankans | 94.5 /100 | #119 | Exceptional $108,234 |
| Immigrants | Northern Africa | 94.3 /100 | #120 | Exceptional $108,161 |
| Europeans | 94.1 /100 | #121 | Exceptional $108,099 |
| Immigrants | Jordan | 92.9 /100 | #122 | Exceptional $107,715 |
| Carpatho Rusyns | 92.2 /100 | #123 | Exceptional $107,502 |
| Pakistanis | 91.7 /100 | #124 | Exceptional $107,390 |
| Taiwanese | 91.4 /100 | #125 | Exceptional $107,295 |
| Serbians | 90.8 /100 | #126 | Exceptional $107,157 |
| Lebanese | 90.5 /100 | #127 | Exceptional $107,086 |
Demographics Similar to Celtics by Median Family Income
In terms of median family income, the demographic groups most similar to Celtics are Dutch ($101,192, a difference of 0.050%), Tlingit-Haida ($101,092, a difference of 0.050%), Guamanian/Chamorro ($101,061, a difference of 0.080%), Immigrants from Portugal ($100,984, a difference of 0.15%), and Immigrants ($100,962, a difference of 0.18%).
| Demographics | Rating | Rank | Median Family Income |
| South Americans | 39.7 /100 | #179 | Fair $101,856 |
| French Canadians | 37.0 /100 | #180 | Fair $101,634 |
| Spaniards | 36.8 /100 | #181 | Fair $101,617 |
| Tsimshian | 35.9 /100 | #182 | Fair $101,543 |
| Kenyans | 34.5 /100 | #183 | Fair $101,417 |
| Immigrants | Costa Rica | 33.7 /100 | #184 | Fair $101,354 |
| Dutch | 31.9 /100 | #185 | Fair $101,192 |
| Celtics | 31.3 /100 | #186 | Fair $101,139 |
| Tlingit-Haida | 30.8 /100 | #187 | Fair $101,092 |
| Guamanians/Chamorros | 30.5 /100 | #188 | Fair $101,061 |
| Immigrants | Portugal | 29.6 /100 | #189 | Fair $100,984 |
| Immigrants | Immigrants | 29.4 /100 | #190 | Fair $100,962 |
| Colombians | 27.2 /100 | #191 | Fair $100,750 |
| Immigrants | Kenya | 26.5 /100 | #192 | Fair $100,679 |
| Iraqis | 26.3 /100 | #193 | Fair $100,658 |