Immigrants from Caribbean vs Swiss Median Earnings
COMPARE
Immigrants from Caribbean
Swiss
Median Earnings
Median Earnings Comparison
Immigrants from Caribbean
Swiss
$41,119
MEDIAN EARNINGS
0.1/ 100
METRIC RATING
299th/ 347
METRIC RANK
$46,315
MEDIAN EARNINGS
45.9/ 100
METRIC RATING
182nd/ 347
METRIC RANK
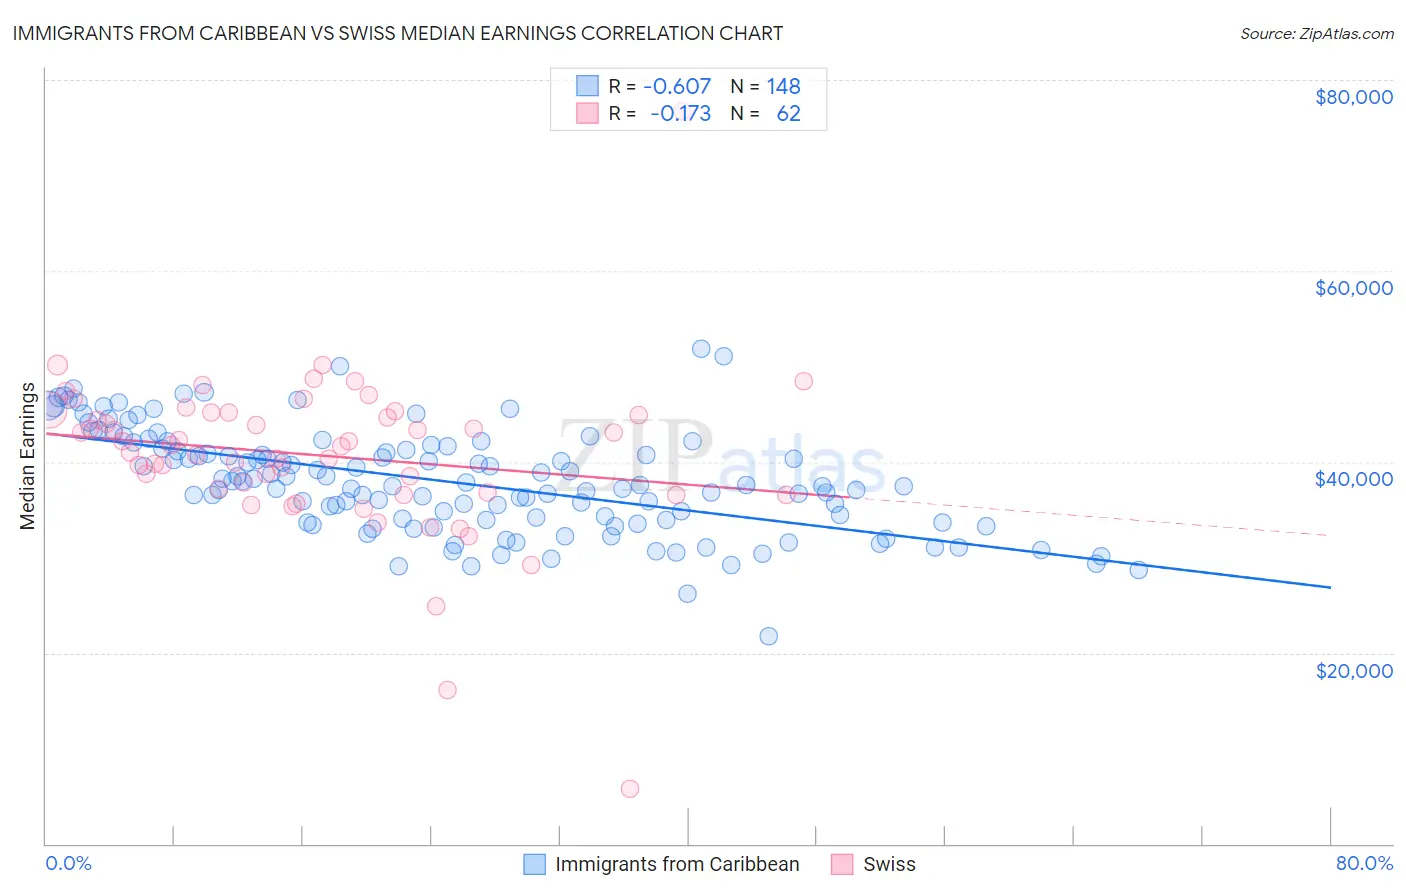
Immigrants from Caribbean vs Swiss Median Earnings Correlation Chart
The statistical analysis conducted on geographies consisting of 450,013,484 people shows a significant negative correlation between the proportion of Immigrants from Caribbean and median earnings in the United States with a correlation coefficient (R) of -0.607 and weighted average of $41,119. Similarly, the statistical analysis conducted on geographies consisting of 464,919,245 people shows a poor negative correlation between the proportion of Swiss and median earnings in the United States with a correlation coefficient (R) of -0.173 and weighted average of $46,315, a difference of 12.6%.
Median Earnings Correlation Summary
| Measurement | Immigrants from Caribbean | Swiss |
| Minimum | $21,741 | $5,729 |
| Maximum | $51,911 | $76,771 |
| Range | $30,170 | $71,042 |
| Mean | $37,958 | $40,710 |
| Median | $37,629 | $41,698 |
| Interquartile 25% (IQ1) | $33,921 | $36,797 |
| Interquartile 75% (IQ3) | $41,541 | $45,132 |
| Interquartile Range (IQR) | $7,620 | $8,335 |
| Standard Deviation (Sample) | $5,439 | $8,837 |
| Standard Deviation (Population) | $5,421 | $8,765 |
Similar Demographics by Median Earnings
Demographics Similar to Immigrants from Caribbean by Median Earnings
In terms of median earnings, the demographic groups most similar to Immigrants from Caribbean are Immigrants from Micronesia ($41,133, a difference of 0.030%), Ute ($41,051, a difference of 0.17%), Immigrants from Latin America ($41,049, a difference of 0.17%), Guatemalan ($41,205, a difference of 0.21%), and Cherokee ($41,252, a difference of 0.32%).
| Demographics | Rating | Rank | Median Earnings |
| U.S. Virgin Islanders | 0.1 /100 | #292 | Tragic $41,448 |
| Immigrants | Zaire | 0.1 /100 | #293 | Tragic $41,325 |
| Potawatomi | 0.1 /100 | #294 | Tragic $41,288 |
| Bangladeshis | 0.1 /100 | #295 | Tragic $41,263 |
| Cherokee | 0.1 /100 | #296 | Tragic $41,252 |
| Guatemalans | 0.1 /100 | #297 | Tragic $41,205 |
| Immigrants | Micronesia | 0.1 /100 | #298 | Tragic $41,133 |
| Immigrants | Caribbean | 0.1 /100 | #299 | Tragic $41,119 |
| Ute | 0.1 /100 | #300 | Tragic $41,051 |
| Immigrants | Latin America | 0.1 /100 | #301 | Tragic $41,049 |
| Shoshone | 0.0 /100 | #302 | Tragic $40,932 |
| Haitians | 0.0 /100 | #303 | Tragic $40,918 |
| Immigrants | Guatemala | 0.0 /100 | #304 | Tragic $40,851 |
| Chickasaw | 0.0 /100 | #305 | Tragic $40,672 |
| Yaqui | 0.0 /100 | #306 | Tragic $40,647 |
Demographics Similar to Swiss by Median Earnings
In terms of median earnings, the demographic groups most similar to Swiss are Immigrants from Cameroon ($46,329, a difference of 0.030%), English ($46,334, a difference of 0.040%), Puget Sound Salish ($46,333, a difference of 0.040%), French ($46,296, a difference of 0.040%), and Colombian ($46,349, a difference of 0.070%).
| Demographics | Rating | Rank | Median Earnings |
| Basques | 48.8 /100 | #175 | Average $46,399 |
| Danes | 48.6 /100 | #176 | Average $46,392 |
| Belgians | 48.0 /100 | #177 | Average $46,375 |
| Colombians | 47.1 /100 | #178 | Average $46,349 |
| English | 46.5 /100 | #179 | Average $46,334 |
| Puget Sound Salish | 46.5 /100 | #180 | Average $46,333 |
| Immigrants | Cameroon | 46.4 /100 | #181 | Average $46,329 |
| Swiss | 45.9 /100 | #182 | Average $46,315 |
| French | 45.2 /100 | #183 | Average $46,296 |
| Immigrants | Kenya | 42.4 /100 | #184 | Average $46,214 |
| Uruguayans | 41.6 /100 | #185 | Average $46,190 |
| Vietnamese | 40.9 /100 | #186 | Average $46,172 |
| Iraqis | 39.9 /100 | #187 | Fair $46,140 |
| Immigrants | Armenia | 38.3 /100 | #188 | Fair $46,094 |
| Spaniards | 37.2 /100 | #189 | Fair $46,059 |