Immigrants from Nicaragua vs Swiss Median Earnings
COMPARE
Immigrants from Nicaragua
Swiss
Median Earnings
Median Earnings Comparison
Immigrants from Nicaragua
Swiss
$41,737
MEDIAN EARNINGS
0.1/ 100
METRIC RATING
285th/ 347
METRIC RANK
$46,315
MEDIAN EARNINGS
45.9/ 100
METRIC RATING
182nd/ 347
METRIC RANK
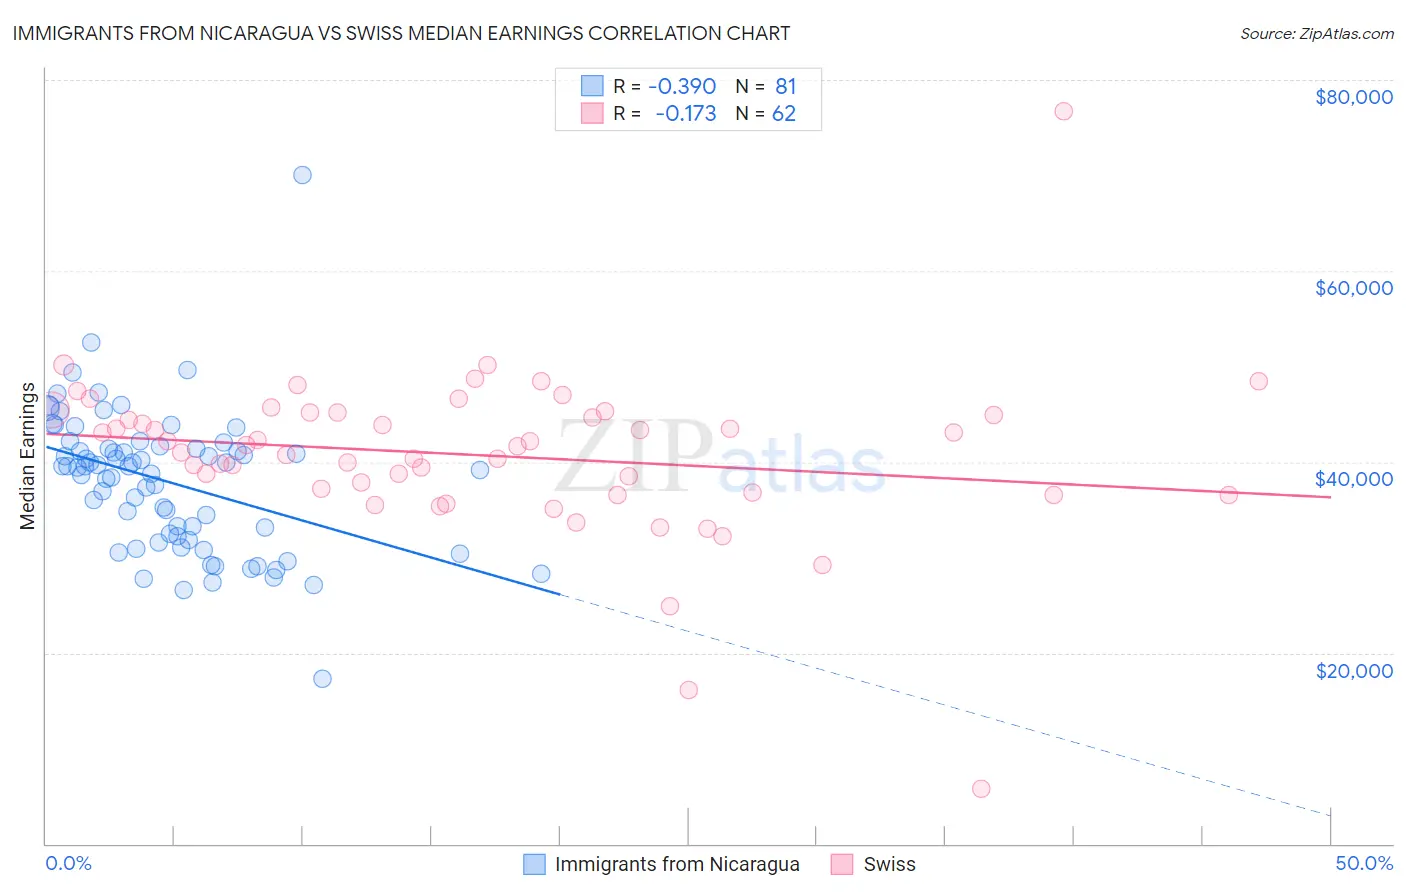
Immigrants from Nicaragua vs Swiss Median Earnings Correlation Chart
The statistical analysis conducted on geographies consisting of 236,337,785 people shows a mild negative correlation between the proportion of Immigrants from Nicaragua and median earnings in the United States with a correlation coefficient (R) of -0.390 and weighted average of $41,737. Similarly, the statistical analysis conducted on geographies consisting of 464,919,245 people shows a poor negative correlation between the proportion of Swiss and median earnings in the United States with a correlation coefficient (R) of -0.173 and weighted average of $46,315, a difference of 11.0%.
Median Earnings Correlation Summary
| Measurement | Immigrants from Nicaragua | Swiss |
| Minimum | $17,262 | $5,729 |
| Maximum | $70,084 | $76,771 |
| Range | $52,822 | $71,042 |
| Mean | $37,945 | $40,710 |
| Median | $39,498 | $41,698 |
| Interquartile 25% (IQ1) | $31,989 | $36,797 |
| Interquartile 75% (IQ3) | $41,525 | $45,132 |
| Interquartile Range (IQR) | $9,536 | $8,335 |
| Standard Deviation (Sample) | $7,439 | $8,837 |
| Standard Deviation (Population) | $7,393 | $8,765 |
Similar Demographics by Median Earnings
Demographics Similar to Immigrants from Nicaragua by Median Earnings
In terms of median earnings, the demographic groups most similar to Immigrants from Nicaragua are Mexican American Indian ($41,719, a difference of 0.040%), Indonesian ($41,701, a difference of 0.090%), Blackfeet ($41,822, a difference of 0.20%), Dominican ($41,864, a difference of 0.31%), and Immigrants from Dominican Republic ($41,554, a difference of 0.44%).
| Demographics | Rating | Rank | Median Earnings |
| Cajuns | 0.3 /100 | #278 | Tragic $42,189 |
| Colville | 0.2 /100 | #279 | Tragic $42,151 |
| Hmong | 0.2 /100 | #280 | Tragic $42,111 |
| Marshallese | 0.2 /100 | #281 | Tragic $41,969 |
| Africans | 0.2 /100 | #282 | Tragic $41,955 |
| Dominicans | 0.2 /100 | #283 | Tragic $41,864 |
| Blackfeet | 0.2 /100 | #284 | Tragic $41,822 |
| Immigrants | Nicaragua | 0.1 /100 | #285 | Tragic $41,737 |
| Mexican American Indians | 0.1 /100 | #286 | Tragic $41,719 |
| Indonesians | 0.1 /100 | #287 | Tragic $41,701 |
| Immigrants | Dominican Republic | 0.1 /100 | #288 | Tragic $41,554 |
| Comanche | 0.1 /100 | #289 | Tragic $41,519 |
| Paiute | 0.1 /100 | #290 | Tragic $41,508 |
| Central American Indians | 0.1 /100 | #291 | Tragic $41,474 |
| U.S. Virgin Islanders | 0.1 /100 | #292 | Tragic $41,448 |
Demographics Similar to Swiss by Median Earnings
In terms of median earnings, the demographic groups most similar to Swiss are Immigrants from Cameroon ($46,329, a difference of 0.030%), English ($46,334, a difference of 0.040%), Puget Sound Salish ($46,333, a difference of 0.040%), French ($46,296, a difference of 0.040%), and Colombian ($46,349, a difference of 0.070%).
| Demographics | Rating | Rank | Median Earnings |
| Basques | 48.8 /100 | #175 | Average $46,399 |
| Danes | 48.6 /100 | #176 | Average $46,392 |
| Belgians | 48.0 /100 | #177 | Average $46,375 |
| Colombians | 47.1 /100 | #178 | Average $46,349 |
| English | 46.5 /100 | #179 | Average $46,334 |
| Puget Sound Salish | 46.5 /100 | #180 | Average $46,333 |
| Immigrants | Cameroon | 46.4 /100 | #181 | Average $46,329 |
| Swiss | 45.9 /100 | #182 | Average $46,315 |
| French | 45.2 /100 | #183 | Average $46,296 |
| Immigrants | Kenya | 42.4 /100 | #184 | Average $46,214 |
| Uruguayans | 41.6 /100 | #185 | Average $46,190 |
| Vietnamese | 40.9 /100 | #186 | Average $46,172 |
| Iraqis | 39.9 /100 | #187 | Fair $46,140 |
| Immigrants | Armenia | 38.3 /100 | #188 | Fair $46,094 |
| Spaniards | 37.2 /100 | #189 | Fair $46,059 |