Trinidadian and Tobagonian vs Seminole Householder Income Ages 45 - 64 years
COMPARE
Trinidadian and Tobagonian
Seminole
Householder Income Ages 45 - 64 years
Householder Income Ages 45 - 64 years Comparison
Trinidadians and Tobagonians
Seminole
$91,357
HOUSEHOLDER INCOME AGES 45 - 64 YEARS
1.1/ 100
METRIC RATING
241st/ 347
METRIC RANK
$80,077
HOUSEHOLDER INCOME AGES 45 - 64 YEARS
0.0/ 100
METRIC RATING
327th/ 347
METRIC RANK
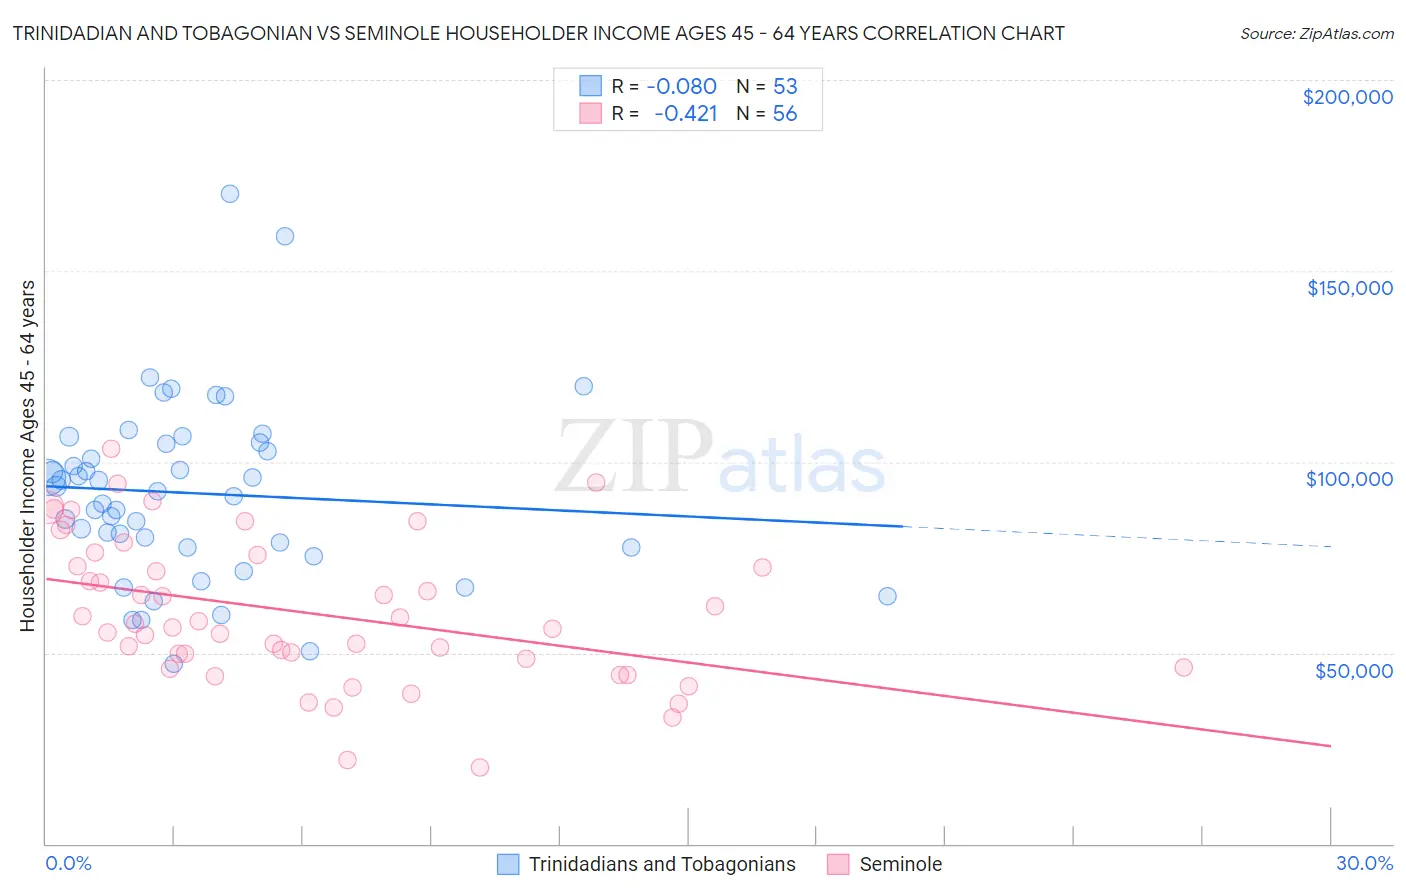
Trinidadian and Tobagonian vs Seminole Householder Income Ages 45 - 64 years Correlation Chart
The statistical analysis conducted on geographies consisting of 219,574,386 people shows a slight negative correlation between the proportion of Trinidadians and Tobagonians and household income with householder between the ages 45 and 64 in the United States with a correlation coefficient (R) of -0.080 and weighted average of $91,357. Similarly, the statistical analysis conducted on geographies consisting of 118,234,136 people shows a moderate negative correlation between the proportion of Seminole and household income with householder between the ages 45 and 64 in the United States with a correlation coefficient (R) of -0.421 and weighted average of $80,077, a difference of 14.1%.
Householder Income Ages 45 - 64 years Correlation Summary
| Measurement | Trinidadian and Tobagonian | Seminole |
| Minimum | $47,269 | $20,000 |
| Maximum | $170,234 | $103,357 |
| Range | $122,965 | $83,357 |
| Mean | $91,778 | $60,470 |
| Median | $92,441 | $57,012 |
| Interquartile 25% (IQ1) | $77,664 | $47,308 |
| Interquartile 75% (IQ3) | $104,934 | $74,206 |
| Interquartile Range (IQR) | $27,270 | $26,898 |
| Standard Deviation (Sample) | $23,595 | $19,035 |
| Standard Deviation (Population) | $23,371 | $18,864 |
Similar Demographics by Householder Income Ages 45 - 64 years
Demographics Similar to Trinidadians and Tobagonians by Householder Income Ages 45 - 64 years
In terms of householder income ages 45 - 64 years, the demographic groups most similar to Trinidadians and Tobagonians are Inupiat ($91,355, a difference of 0.0%), Immigrants from Trinidad and Tobago ($91,347, a difference of 0.010%), Immigrants from Burma/Myanmar ($91,385, a difference of 0.030%), Immigrants from Middle Africa ($91,293, a difference of 0.070%), and Immigrants from Ecuador ($91,462, a difference of 0.12%).
| Demographics | Rating | Rank | Householder Income Ages 45 - 64 years |
| Immigrants | El Salvador | 2.7 /100 | #234 | Tragic $93,176 |
| Nicaraguans | 2.0 /100 | #235 | Tragic $92,554 |
| Immigrants | Western Africa | 1.8 /100 | #236 | Tragic $92,384 |
| Immigrants | Bangladesh | 1.7 /100 | #237 | Tragic $92,208 |
| Pennsylvania Germans | 1.5 /100 | #238 | Tragic $91,956 |
| Immigrants | Ecuador | 1.2 /100 | #239 | Tragic $91,462 |
| Immigrants | Burma/Myanmar | 1.1 /100 | #240 | Tragic $91,385 |
| Trinidadians and Tobagonians | 1.1 /100 | #241 | Tragic $91,357 |
| Inupiat | 1.1 /100 | #242 | Tragic $91,355 |
| Immigrants | Trinidad and Tobago | 1.1 /100 | #243 | Tragic $91,347 |
| Immigrants | Middle Africa | 1.1 /100 | #244 | Tragic $91,293 |
| Guyanese | 0.9 /100 | #245 | Tragic $90,966 |
| Central Americans | 0.9 /100 | #246 | Tragic $90,951 |
| Alaskan Athabascans | 0.9 /100 | #247 | Tragic $90,951 |
| Immigrants | Laos | 0.9 /100 | #248 | Tragic $90,909 |
Demographics Similar to Seminole by Householder Income Ages 45 - 64 years
In terms of householder income ages 45 - 64 years, the demographic groups most similar to Seminole are Native/Alaskan ($79,816, a difference of 0.33%), Dominican ($80,623, a difference of 0.68%), Immigrants from Cuba ($80,662, a difference of 0.73%), Yup'ik ($81,000, a difference of 1.1%), and Dutch West Indian ($79,171, a difference of 1.1%).
| Demographics | Rating | Rank | Householder Income Ages 45 - 64 years |
| Apache | 0.0 /100 | #320 | Tragic $82,184 |
| Yuman | 0.0 /100 | #321 | Tragic $82,139 |
| Sioux | 0.0 /100 | #322 | Tragic $81,750 |
| Bahamians | 0.0 /100 | #323 | Tragic $81,369 |
| Yup'ik | 0.0 /100 | #324 | Tragic $81,000 |
| Immigrants | Cuba | 0.0 /100 | #325 | Tragic $80,662 |
| Dominicans | 0.0 /100 | #326 | Tragic $80,623 |
| Seminole | 0.0 /100 | #327 | Tragic $80,077 |
| Natives/Alaskans | 0.0 /100 | #328 | Tragic $79,816 |
| Dutch West Indians | 0.0 /100 | #329 | Tragic $79,171 |
| Creek | 0.0 /100 | #330 | Tragic $78,960 |
| Immigrants | Dominican Republic | 0.0 /100 | #331 | Tragic $78,836 |
| Blacks/African Americans | 0.0 /100 | #332 | Tragic $78,556 |
| Immigrants | Congo | 0.0 /100 | #333 | Tragic $77,850 |
| Menominee | 0.0 /100 | #334 | Tragic $76,903 |