Trinidadian and Tobagonian vs Potawatomi In Labor Force | Age 20-64
COMPARE
Trinidadian and Tobagonian
Potawatomi
In Labor Force | Age 20-64
In Labor Force | Age 20-64 Comparison
Trinidadians and Tobagonians
Potawatomi
79.0%
IN LABOR FORCE | AGE 20-64
2.3/ 100
METRIC RATING
240th/ 347
METRIC RANK
77.2%
IN LABOR FORCE | AGE 20-64
0.0/ 100
METRIC RATING
306th/ 347
METRIC RANK
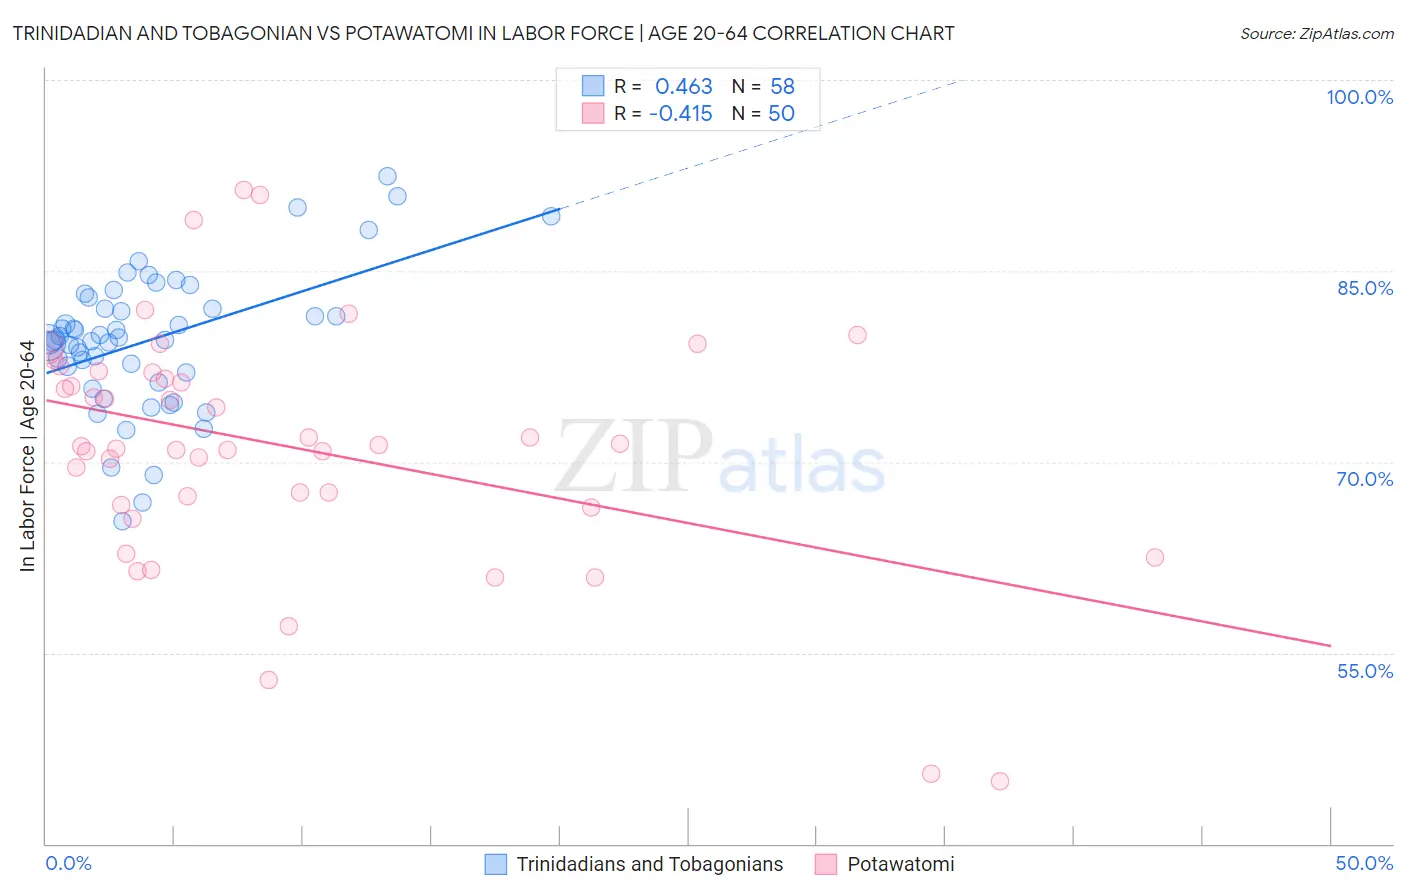
Trinidadian and Tobagonian vs Potawatomi In Labor Force | Age 20-64 Correlation Chart
The statistical analysis conducted on geographies consisting of 219,883,468 people shows a moderate positive correlation between the proportion of Trinidadians and Tobagonians and labor force participation rate among population between the ages 20 and 64 in the United States with a correlation coefficient (R) of 0.463 and weighted average of 79.0%. Similarly, the statistical analysis conducted on geographies consisting of 117,773,870 people shows a moderate negative correlation between the proportion of Potawatomi and labor force participation rate among population between the ages 20 and 64 in the United States with a correlation coefficient (R) of -0.415 and weighted average of 77.2%, a difference of 2.3%.
In Labor Force | Age 20-64 Correlation Summary
| Measurement | Trinidadian and Tobagonian | Potawatomi |
| Minimum | 65.3% | 44.9% |
| Maximum | 92.4% | 91.4% |
| Range | 27.1% | 46.5% |
| Mean | 79.5% | 71.2% |
| Median | 79.6% | 71.3% |
| Interquartile 25% (IQ1) | 77.0% | 66.7% |
| Interquartile 75% (IQ3) | 82.0% | 77.0% |
| Interquartile Range (IQR) | 5.0% | 10.4% |
| Standard Deviation (Sample) | 5.4% | 9.6% |
| Standard Deviation (Population) | 5.4% | 9.5% |
Similar Demographics by In Labor Force | Age 20-64
Demographics Similar to Trinidadians and Tobagonians by In Labor Force | Age 20-64
In terms of in labor force | age 20-64, the demographic groups most similar to Trinidadians and Tobagonians are Welsh (79.0%, a difference of 0.010%), Immigrants from Jamaica (79.0%, a difference of 0.020%), Jamaican (78.9%, a difference of 0.030%), Immigrants from North America (79.0%, a difference of 0.040%), and Immigrants from Micronesia (78.9%, a difference of 0.040%).
| Demographics | Rating | Rank | In Labor Force | Age 20-64 |
| Japanese | 4.0 /100 | #233 | Tragic 79.1% |
| Immigrants | Canada | 3.2 /100 | #234 | Tragic 79.0% |
| Tlingit-Haida | 3.2 /100 | #235 | Tragic 79.0% |
| Samoans | 2.9 /100 | #236 | Tragic 79.0% |
| Immigrants | North America | 2.9 /100 | #237 | Tragic 79.0% |
| Immigrants | Jamaica | 2.6 /100 | #238 | Tragic 79.0% |
| Welsh | 2.4 /100 | #239 | Tragic 79.0% |
| Trinidadians and Tobagonians | 2.3 /100 | #240 | Tragic 79.0% |
| Jamaicans | 2.0 /100 | #241 | Tragic 78.9% |
| Immigrants | Micronesia | 1.9 /100 | #242 | Tragic 78.9% |
| Immigrants | West Indies | 1.7 /100 | #243 | Tragic 78.9% |
| French | 1.5 /100 | #244 | Tragic 78.9% |
| Scottish | 1.3 /100 | #245 | Tragic 78.9% |
| Immigrants | Trinidad and Tobago | 1.1 /100 | #246 | Tragic 78.8% |
| Immigrants | Germany | 1.0 /100 | #247 | Tragic 78.8% |
Demographics Similar to Potawatomi by In Labor Force | Age 20-64
In terms of in labor force | age 20-64, the demographic groups most similar to Potawatomi are Mexican (77.2%, a difference of 0.020%), Immigrants from Mexico (77.3%, a difference of 0.060%), Chippewa (77.3%, a difference of 0.12%), Central American Indian (77.1%, a difference of 0.17%), and Alaska Native (77.0%, a difference of 0.23%).
| Demographics | Rating | Rank | In Labor Force | Age 20-64 |
| Hispanics or Latinos | 0.0 /100 | #299 | Tragic 77.6% |
| Spanish American Indians | 0.0 /100 | #300 | Tragic 77.6% |
| Nepalese | 0.0 /100 | #301 | Tragic 77.5% |
| Iroquois | 0.0 /100 | #302 | Tragic 77.5% |
| Chippewa | 0.0 /100 | #303 | Tragic 77.3% |
| Immigrants | Mexico | 0.0 /100 | #304 | Tragic 77.3% |
| Mexicans | 0.0 /100 | #305 | Tragic 77.2% |
| Potawatomi | 0.0 /100 | #306 | Tragic 77.2% |
| Central American Indians | 0.0 /100 | #307 | Tragic 77.1% |
| Alaska Natives | 0.0 /100 | #308 | Tragic 77.0% |
| Americans | 0.0 /100 | #309 | Tragic 77.0% |
| Comanche | 0.0 /100 | #310 | Tragic 77.0% |
| Blackfeet | 0.0 /100 | #311 | Tragic 77.0% |
| Alaskan Athabascans | 0.0 /100 | #312 | Tragic 76.9% |
| Shoshone | 0.0 /100 | #313 | Tragic 76.8% |