Trinidadian and Tobagonian vs Immigrants from Australia Male Poverty
COMPARE
Trinidadian and Tobagonian
Immigrants from Australia
Male Poverty
Male Poverty Comparison
Trinidadians and Tobagonians
Immigrants from Australia
13.1%
MALE POVERTY
0.1/ 100
METRIC RATING
261st/ 347
METRIC RANK
10.2%
MALE POVERTY
97.1/ 100
METRIC RATING
69th/ 347
METRIC RANK
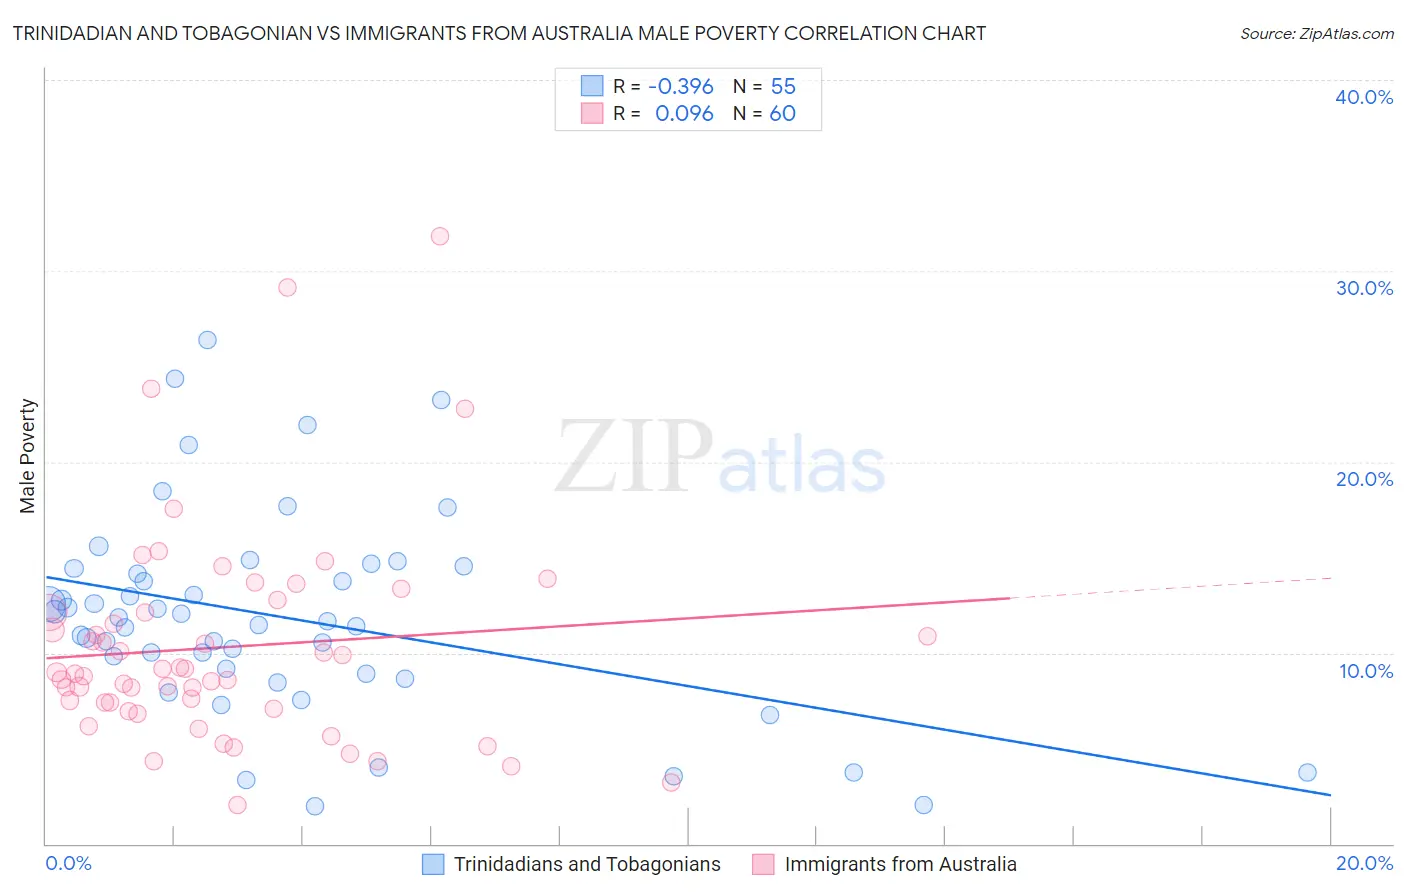
Trinidadian and Tobagonian vs Immigrants from Australia Male Poverty Correlation Chart
The statistical analysis conducted on geographies consisting of 219,673,525 people shows a mild negative correlation between the proportion of Trinidadians and Tobagonians and poverty level among males in the United States with a correlation coefficient (R) of -0.396 and weighted average of 13.1%. Similarly, the statistical analysis conducted on geographies consisting of 227,114,617 people shows a slight positive correlation between the proportion of Immigrants from Australia and poverty level among males in the United States with a correlation coefficient (R) of 0.096 and weighted average of 10.2%, a difference of 28.2%.
Male Poverty Correlation Summary
| Measurement | Trinidadian and Tobagonian | Immigrants from Australia |
| Minimum | 2.0% | 2.0% |
| Maximum | 26.4% | 31.8% |
| Range | 24.4% | 29.8% |
| Mean | 11.9% | 10.3% |
| Median | 11.7% | 8.9% |
| Interquartile 25% (IQ1) | 8.9% | 7.2% |
| Interquartile 75% (IQ3) | 14.4% | 12.1% |
| Interquartile Range (IQR) | 5.5% | 4.9% |
| Standard Deviation (Sample) | 5.3% | 5.6% |
| Standard Deviation (Population) | 5.3% | 5.6% |
Similar Demographics by Male Poverty
Demographics Similar to Trinidadians and Tobagonians by Male Poverty
In terms of male poverty, the demographic groups most similar to Trinidadians and Tobagonians are Ottawa (13.1%, a difference of 0.020%), Spanish American Indian (13.1%, a difference of 0.050%), Cherokee (13.1%, a difference of 0.13%), Cape Verdean (13.1%, a difference of 0.30%), and Immigrants from Trinidad and Tobago (13.1%, a difference of 0.42%).
| Demographics | Rating | Rank | Male Poverty |
| Mexican American Indians | 0.1 /100 | #254 | Tragic 13.0% |
| Immigrants | Liberia | 0.1 /100 | #255 | Tragic 13.0% |
| Immigrants | Burma/Myanmar | 0.1 /100 | #256 | Tragic 13.0% |
| Immigrants | Trinidad and Tobago | 0.1 /100 | #257 | Tragic 13.1% |
| Cape Verdeans | 0.1 /100 | #258 | Tragic 13.1% |
| Cherokee | 0.1 /100 | #259 | Tragic 13.1% |
| Ottawa | 0.1 /100 | #260 | Tragic 13.1% |
| Trinidadians and Tobagonians | 0.1 /100 | #261 | Tragic 13.1% |
| Spanish American Indians | 0.1 /100 | #262 | Tragic 13.1% |
| Central Americans | 0.1 /100 | #263 | Tragic 13.2% |
| Iroquois | 0.1 /100 | #264 | Tragic 13.2% |
| Jamaicans | 0.1 /100 | #265 | Tragic 13.2% |
| Immigrants | Guyana | 0.1 /100 | #266 | Tragic 13.2% |
| Immigrants | Jamaica | 0.1 /100 | #267 | Tragic 13.3% |
| Sub-Saharan Africans | 0.1 /100 | #268 | Tragic 13.3% |
Demographics Similar to Immigrants from Australia by Male Poverty
In terms of male poverty, the demographic groups most similar to Immigrants from Australia are Paraguayan (10.2%, a difference of 0.020%), European (10.2%, a difference of 0.040%), Immigrants from Canada (10.2%, a difference of 0.050%), Immigrants from Sri Lanka (10.2%, a difference of 0.13%), and Immigrants from Asia (10.2%, a difference of 0.13%).
| Demographics | Rating | Rank | Male Poverty |
| Immigrants | Italy | 97.8 /100 | #62 | Exceptional 10.2% |
| Slovaks | 97.7 /100 | #63 | Exceptional 10.2% |
| Swiss | 97.5 /100 | #64 | Exceptional 10.2% |
| Zimbabweans | 97.5 /100 | #65 | Exceptional 10.2% |
| Serbians | 97.5 /100 | #66 | Exceptional 10.2% |
| Immigrants | Netherlands | 97.3 /100 | #67 | Exceptional 10.2% |
| Immigrants | Sri Lanka | 97.2 /100 | #68 | Exceptional 10.2% |
| Immigrants | Australia | 97.1 /100 | #69 | Exceptional 10.2% |
| Paraguayans | 97.1 /100 | #70 | Exceptional 10.2% |
| Europeans | 97.1 /100 | #71 | Exceptional 10.2% |
| Immigrants | Canada | 97.1 /100 | #72 | Exceptional 10.2% |
| Immigrants | Asia | 97.0 /100 | #73 | Exceptional 10.2% |
| Immigrants | Eastern Europe | 96.9 /100 | #74 | Exceptional 10.2% |
| Carpatho Rusyns | 96.9 /100 | #75 | Exceptional 10.2% |
| Dutch | 96.9 /100 | #76 | Exceptional 10.2% |