Immigrants from Serbia vs Immigrants from Australia Median Family Income
COMPARE
Immigrants from Serbia
Immigrants from Australia
Median Family Income
Median Family Income Comparison
Immigrants from Serbia
Immigrants from Australia
$113,463
MEDIAN FAMILY INCOME
99.6/ 100
METRIC RATING
68th/ 347
METRIC RANK
$126,620
MEDIAN FAMILY INCOME
100.0/ 100
METRIC RATING
13th/ 347
METRIC RANK
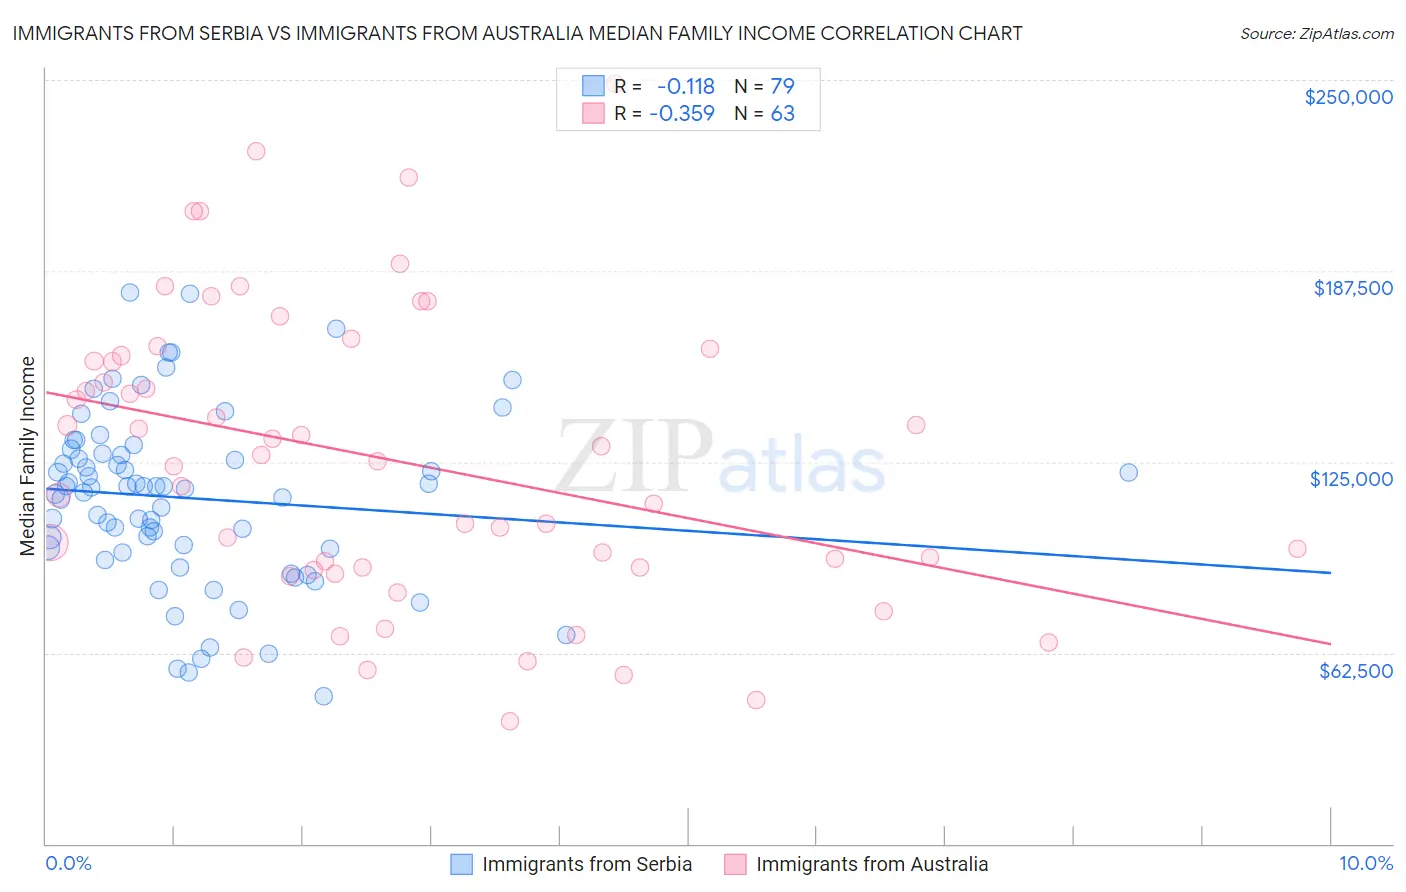
Immigrants from Serbia vs Immigrants from Australia Median Family Income Correlation Chart
The statistical analysis conducted on geographies consisting of 131,712,568 people shows a poor negative correlation between the proportion of Immigrants from Serbia and median family income in the United States with a correlation coefficient (R) of -0.118 and weighted average of $113,463. Similarly, the statistical analysis conducted on geographies consisting of 227,105,113 people shows a mild negative correlation between the proportion of Immigrants from Australia and median family income in the United States with a correlation coefficient (R) of -0.359 and weighted average of $126,620, a difference of 11.6%.
Median Family Income Correlation Summary
| Measurement | Immigrants from Serbia | Immigrants from Australia |
| Minimum | $48,194 | $40,038 |
| Maximum | $180,588 | $248,750 |
| Range | $132,394 | $208,712 |
| Mean | $113,133 | $125,759 |
| Median | $116,433 | $125,053 |
| Interquartile 25% (IQ1) | $96,750 | $90,291 |
| Interquartile 75% (IQ3) | $127,696 | $159,793 |
| Interquartile Range (IQR) | $30,946 | $69,502 |
| Standard Deviation (Sample) | $28,356 | $48,023 |
| Standard Deviation (Population) | $28,176 | $47,640 |
Similar Demographics by Median Family Income
Demographics Similar to Immigrants from Serbia by Median Family Income
In terms of median family income, the demographic groups most similar to Immigrants from Serbia are Immigrants from Bulgaria ($113,461, a difference of 0.0%), Immigrants from Romania ($113,434, a difference of 0.030%), South African ($113,229, a difference of 0.21%), Immigrants from Spain ($113,815, a difference of 0.31%), and Afghan ($112,971, a difference of 0.44%).
| Demographics | Rating | Rank | Median Family Income |
| Immigrants | Belarus | 99.8 /100 | #61 | Exceptional $114,586 |
| Mongolians | 99.8 /100 | #62 | Exceptional $114,553 |
| Immigrants | Pakistan | 99.8 /100 | #63 | Exceptional $114,406 |
| Immigrants | Scotland | 99.7 /100 | #64 | Exceptional $114,392 |
| Egyptians | 99.7 /100 | #65 | Exceptional $114,119 |
| Paraguayans | 99.7 /100 | #66 | Exceptional $114,016 |
| Immigrants | Spain | 99.7 /100 | #67 | Exceptional $113,815 |
| Immigrants | Serbia | 99.6 /100 | #68 | Exceptional $113,463 |
| Immigrants | Bulgaria | 99.6 /100 | #69 | Exceptional $113,461 |
| Immigrants | Romania | 99.6 /100 | #70 | Exceptional $113,434 |
| South Africans | 99.5 /100 | #71 | Exceptional $113,229 |
| Afghans | 99.5 /100 | #72 | Exceptional $112,971 |
| Laotians | 99.5 /100 | #73 | Exceptional $112,859 |
| Immigrants | Italy | 99.4 /100 | #74 | Exceptional $112,848 |
| Immigrants | Western Europe | 99.4 /100 | #75 | Exceptional $112,688 |
Demographics Similar to Immigrants from Australia by Median Family Income
In terms of median family income, the demographic groups most similar to Immigrants from Australia are Cypriot ($127,064, a difference of 0.35%), Immigrants from South Central Asia ($125,956, a difference of 0.53%), Immigrants from Israel ($127,430, a difference of 0.64%), Immigrants from Ireland ($127,584, a difference of 0.76%), and Eastern European ($125,546, a difference of 0.86%).
| Demographics | Rating | Rank | Median Family Income |
| Thais | 100.0 /100 | #6 | Exceptional $131,281 |
| Immigrants | Hong Kong | 100.0 /100 | #7 | Exceptional $131,067 |
| Immigrants | Iran | 100.0 /100 | #8 | Exceptional $130,894 |
| Okinawans | 100.0 /100 | #9 | Exceptional $129,979 |
| Immigrants | Ireland | 100.0 /100 | #10 | Exceptional $127,584 |
| Immigrants | Israel | 100.0 /100 | #11 | Exceptional $127,430 |
| Cypriots | 100.0 /100 | #12 | Exceptional $127,064 |
| Immigrants | Australia | 100.0 /100 | #13 | Exceptional $126,620 |
| Immigrants | South Central Asia | 100.0 /100 | #14 | Exceptional $125,956 |
| Eastern Europeans | 100.0 /100 | #15 | Exceptional $125,546 |
| Immigrants | China | 100.0 /100 | #16 | Exceptional $125,540 |
| Indians (Asian) | 100.0 /100 | #17 | Exceptional $125,312 |
| Immigrants | Eastern Asia | 100.0 /100 | #18 | Exceptional $125,150 |
| Immigrants | Belgium | 100.0 /100 | #19 | Exceptional $123,831 |
| Burmese | 100.0 /100 | #20 | Exceptional $123,369 |