Austrian vs Immigrants from Australia Median Family Income
COMPARE
Austrian
Immigrants from Australia
Median Family Income
Median Family Income Comparison
Austrians
Immigrants from Australia
$111,306
MEDIAN FAMILY INCOME
98.8/ 100
METRIC RATING
87th/ 347
METRIC RANK
$126,620
MEDIAN FAMILY INCOME
100.0/ 100
METRIC RATING
13th/ 347
METRIC RANK
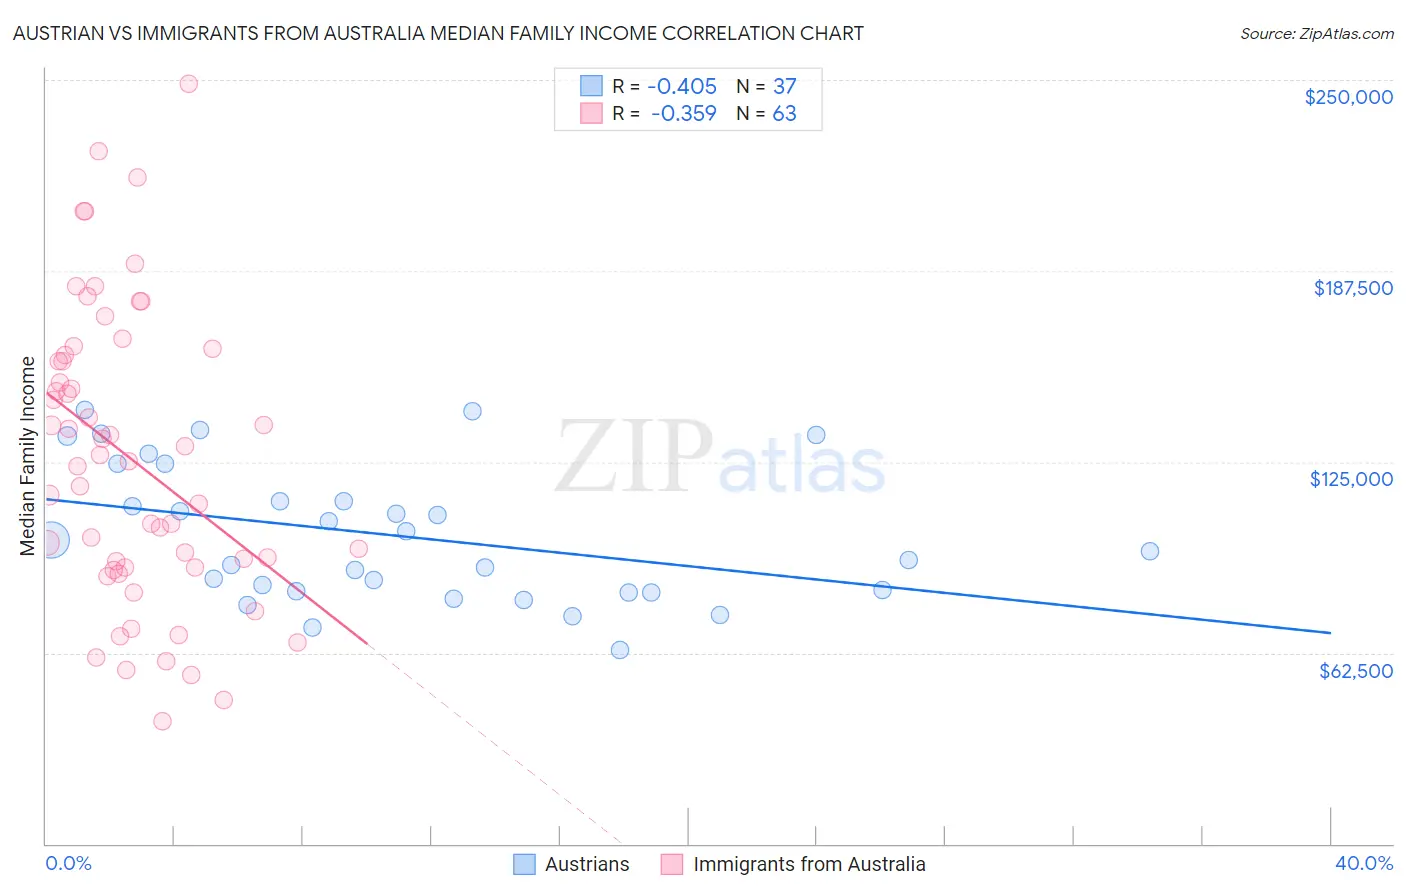
Austrian vs Immigrants from Australia Median Family Income Correlation Chart
The statistical analysis conducted on geographies consisting of 451,614,723 people shows a moderate negative correlation between the proportion of Austrians and median family income in the United States with a correlation coefficient (R) of -0.405 and weighted average of $111,306. Similarly, the statistical analysis conducted on geographies consisting of 227,105,113 people shows a mild negative correlation between the proportion of Immigrants from Australia and median family income in the United States with a correlation coefficient (R) of -0.359 and weighted average of $126,620, a difference of 13.8%.
Median Family Income Correlation Summary
| Measurement | Austrian | Immigrants from Australia |
| Minimum | $63,235 | $40,038 |
| Maximum | $142,142 | $248,750 |
| Range | $78,907 | $208,712 |
| Mean | $100,879 | $125,759 |
| Median | $95,625 | $125,053 |
| Interquartile 25% (IQ1) | $82,447 | $90,291 |
| Interquartile 75% (IQ3) | $118,182 | $159,793 |
| Interquartile Range (IQR) | $35,735 | $69,502 |
| Standard Deviation (Sample) | $22,141 | $48,023 |
| Standard Deviation (Population) | $21,840 | $47,640 |
Similar Demographics by Median Family Income
Demographics Similar to Austrians by Median Family Income
In terms of median family income, the demographic groups most similar to Austrians are Immigrants from Hungary ($111,378, a difference of 0.060%), Croatian ($111,370, a difference of 0.060%), Ukrainian ($111,368, a difference of 0.060%), Romanian ($111,243, a difference of 0.060%), and Immigrants from Egypt ($111,689, a difference of 0.34%).
| Demographics | Rating | Rank | Median Family Income |
| Immigrants | Croatia | 99.3 /100 | #80 | Exceptional $112,323 |
| Immigrants | North America | 99.2 /100 | #81 | Exceptional $112,151 |
| Immigrants | England | 99.2 /100 | #82 | Exceptional $112,038 |
| Immigrants | Egypt | 99.0 /100 | #83 | Exceptional $111,689 |
| Immigrants | Hungary | 98.8 /100 | #84 | Exceptional $111,378 |
| Croatians | 98.8 /100 | #85 | Exceptional $111,370 |
| Ukrainians | 98.8 /100 | #86 | Exceptional $111,368 |
| Austrians | 98.8 /100 | #87 | Exceptional $111,306 |
| Romanians | 98.8 /100 | #88 | Exceptional $111,243 |
| Immigrants | Argentina | 98.5 /100 | #89 | Exceptional $110,873 |
| Northern Europeans | 98.3 /100 | #90 | Exceptional $110,635 |
| Immigrants | Southern Europe | 98.3 /100 | #91 | Exceptional $110,614 |
| Immigrants | Lebanon | 97.9 /100 | #92 | Exceptional $110,159 |
| Immigrants | Kazakhstan | 97.8 /100 | #93 | Exceptional $110,137 |
| Koreans | 97.8 /100 | #94 | Exceptional $110,103 |
Demographics Similar to Immigrants from Australia by Median Family Income
In terms of median family income, the demographic groups most similar to Immigrants from Australia are Cypriot ($127,064, a difference of 0.35%), Immigrants from South Central Asia ($125,956, a difference of 0.53%), Immigrants from Israel ($127,430, a difference of 0.64%), Immigrants from Ireland ($127,584, a difference of 0.76%), and Eastern European ($125,546, a difference of 0.86%).
| Demographics | Rating | Rank | Median Family Income |
| Thais | 100.0 /100 | #6 | Exceptional $131,281 |
| Immigrants | Hong Kong | 100.0 /100 | #7 | Exceptional $131,067 |
| Immigrants | Iran | 100.0 /100 | #8 | Exceptional $130,894 |
| Okinawans | 100.0 /100 | #9 | Exceptional $129,979 |
| Immigrants | Ireland | 100.0 /100 | #10 | Exceptional $127,584 |
| Immigrants | Israel | 100.0 /100 | #11 | Exceptional $127,430 |
| Cypriots | 100.0 /100 | #12 | Exceptional $127,064 |
| Immigrants | Australia | 100.0 /100 | #13 | Exceptional $126,620 |
| Immigrants | South Central Asia | 100.0 /100 | #14 | Exceptional $125,956 |
| Eastern Europeans | 100.0 /100 | #15 | Exceptional $125,546 |
| Immigrants | China | 100.0 /100 | #16 | Exceptional $125,540 |
| Indians (Asian) | 100.0 /100 | #17 | Exceptional $125,312 |
| Immigrants | Eastern Asia | 100.0 /100 | #18 | Exceptional $125,150 |
| Immigrants | Belgium | 100.0 /100 | #19 | Exceptional $123,831 |
| Burmese | 100.0 /100 | #20 | Exceptional $123,369 |