Tongan vs Scandinavian Median Family Income
COMPARE
Tongan
Scandinavian
Median Family Income
Median Family Income Comparison
Tongans
Scandinavians
$105,967
MEDIAN FAMILY INCOME
84.3/ 100
METRIC RATING
143rd/ 347
METRIC RANK
$104,410
MEDIAN FAMILY INCOME
70.8/ 100
METRIC RATING
158th/ 347
METRIC RANK
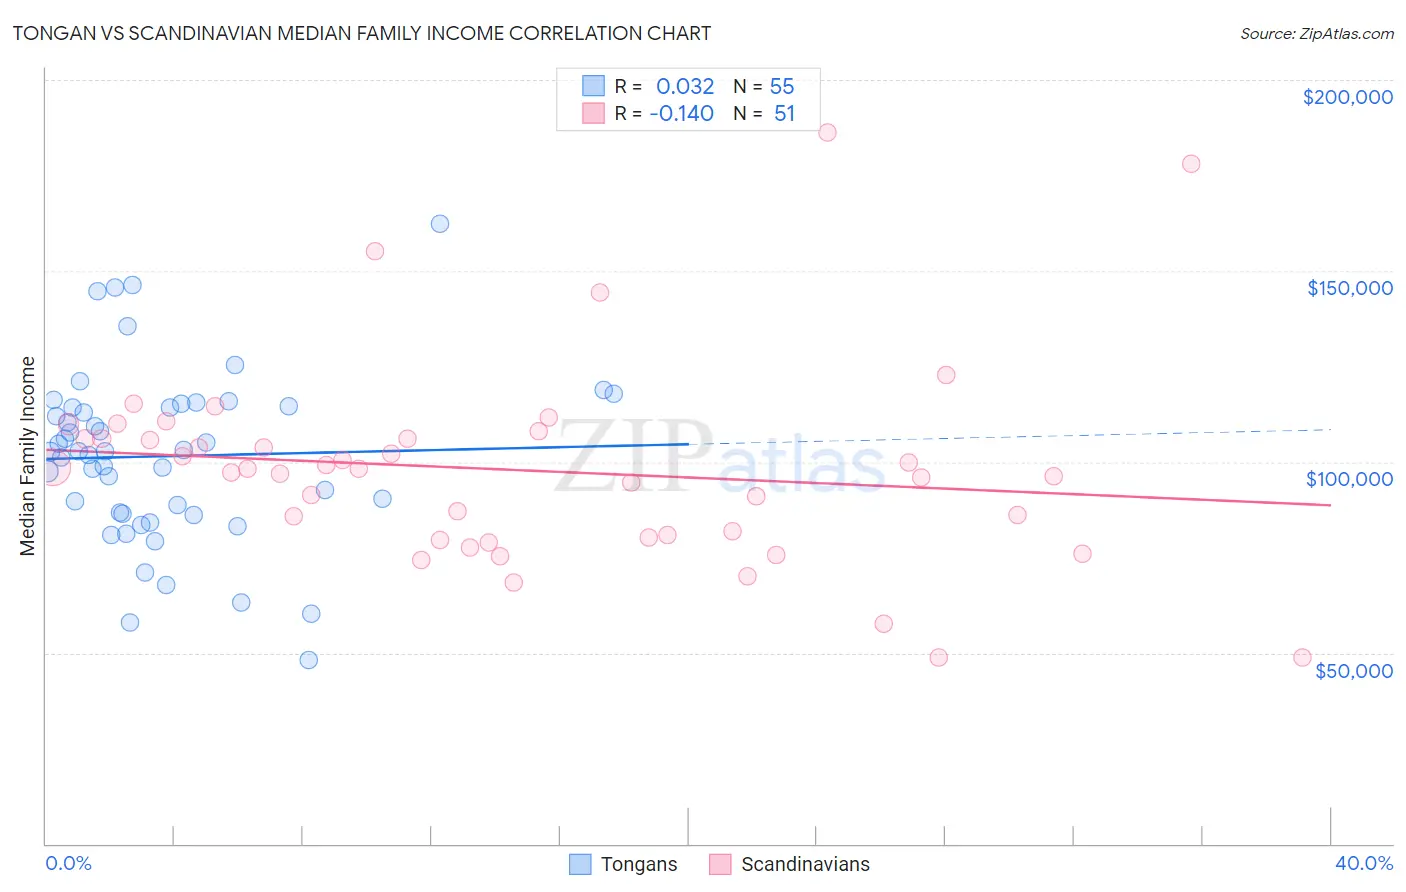
Tongan vs Scandinavian Median Family Income Correlation Chart
The statistical analysis conducted on geographies consisting of 102,775,236 people shows no correlation between the proportion of Tongans and median family income in the United States with a correlation coefficient (R) of 0.032 and weighted average of $105,967. Similarly, the statistical analysis conducted on geographies consisting of 472,034,552 people shows a poor negative correlation between the proportion of Scandinavians and median family income in the United States with a correlation coefficient (R) of -0.140 and weighted average of $104,410, a difference of 1.5%.
Median Family Income Correlation Summary
| Measurement | Tongan | Scandinavian |
| Minimum | $48,125 | $48,750 |
| Maximum | $162,500 | $186,250 |
| Range | $114,375 | $137,500 |
| Mean | $101,505 | $97,868 |
| Median | $102,675 | $98,046 |
| Interquartile 25% (IQ1) | $86,338 | $80,113 |
| Interquartile 75% (IQ3) | $114,438 | $106,098 |
| Interquartile Range (IQR) | $28,100 | $25,985 |
| Standard Deviation (Sample) | $22,609 | $26,299 |
| Standard Deviation (Population) | $22,402 | $26,040 |
Demographics Similar to Tongans and Scandinavians by Median Family Income
In terms of median family income, the demographic groups most similar to Tongans are Immigrants from Morocco ($105,964, a difference of 0.0%), Slovene ($106,020, a difference of 0.050%), Danish ($105,900, a difference of 0.060%), Czech ($105,839, a difference of 0.12%), and Immigrants from Syria ($106,118, a difference of 0.14%). Similarly, the demographic groups most similar to Scandinavians are Swiss ($104,396, a difference of 0.010%), Moroccan ($104,488, a difference of 0.080%), Scottish ($104,288, a difference of 0.12%), Basque ($104,760, a difference of 0.34%), and Native Hawaiian ($104,910, a difference of 0.48%).
| Demographics | Rating | Rank | Median Family Income |
| Norwegians | 85.5 /100 | #140 | Excellent $106,144 |
| Immigrants | Syria | 85.3 /100 | #141 | Excellent $106,118 |
| Slovenes | 84.7 /100 | #142 | Excellent $106,020 |
| Tongans | 84.3 /100 | #143 | Excellent $105,967 |
| Immigrants | Morocco | 84.3 /100 | #144 | Excellent $105,964 |
| Danes | 83.8 /100 | #145 | Excellent $105,900 |
| Czechs | 83.4 /100 | #146 | Excellent $105,839 |
| Immigrants | Chile | 82.1 /100 | #147 | Excellent $105,655 |
| Hungarians | 81.7 /100 | #148 | Excellent $105,609 |
| Immigrants | Germany | 80.9 /100 | #149 | Excellent $105,507 |
| Irish | 80.5 /100 | #150 | Excellent $105,453 |
| Peruvians | 80.4 /100 | #151 | Excellent $105,444 |
| Immigrants | Albania | 79.1 /100 | #152 | Good $105,285 |
| Slavs | 77.9 /100 | #153 | Good $105,144 |
| Immigrants | Nepal | 76.3 /100 | #154 | Good $104,966 |
| Native Hawaiians | 75.8 /100 | #155 | Good $104,910 |
| Basques | 74.4 /100 | #156 | Good $104,760 |
| Moroccans | 71.6 /100 | #157 | Good $104,488 |
| Scandinavians | 70.8 /100 | #158 | Good $104,410 |
| Swiss | 70.7 /100 | #159 | Good $104,396 |
| Scottish | 69.5 /100 | #160 | Good $104,288 |