Slavic vs Malaysian Householder Income Over 65 years
COMPARE
Slavic
Malaysian
Householder Income Over 65 years
Householder Income Over 65 years Comparison
Slavs
Malaysians
$61,709
HOUSEHOLDER INCOME OVER 65 YEARS
68.5/ 100
METRIC RATING
150th/ 347
METRIC RANK
$58,244
HOUSEHOLDER INCOME OVER 65 YEARS
5.5/ 100
METRIC RATING
219th/ 347
METRIC RANK
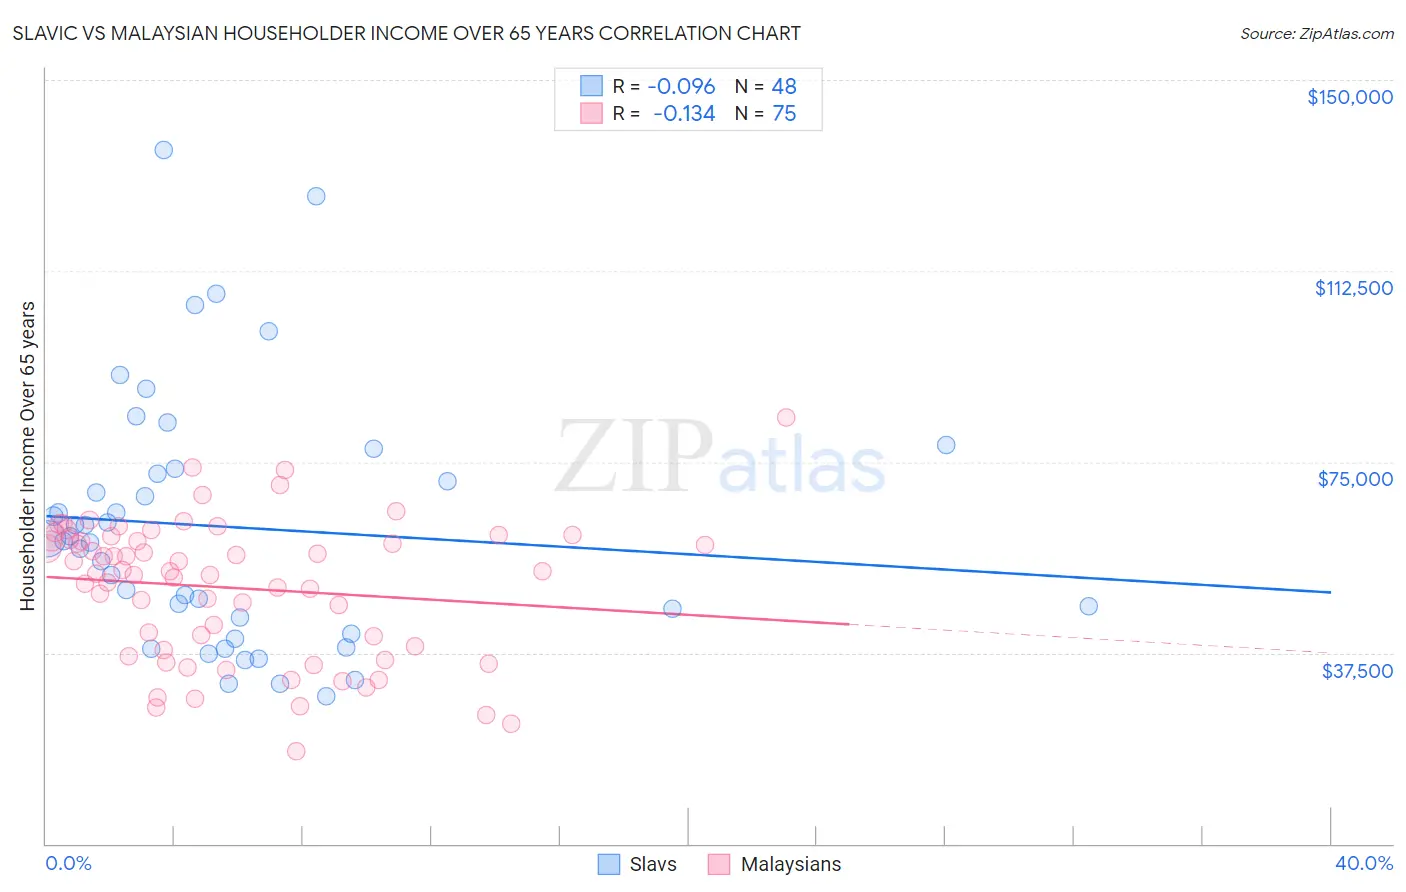
Slavic vs Malaysian Householder Income Over 65 years Correlation Chart
The statistical analysis conducted on geographies consisting of 270,416,943 people shows a slight negative correlation between the proportion of Slavs and household income with householder over the age of 65 in the United States with a correlation coefficient (R) of -0.096 and weighted average of $61,709. Similarly, the statistical analysis conducted on geographies consisting of 225,600,084 people shows a poor negative correlation between the proportion of Malaysians and household income with householder over the age of 65 in the United States with a correlation coefficient (R) of -0.134 and weighted average of $58,244, a difference of 5.9%.
Householder Income Over 65 years Correlation Summary
| Measurement | Slavic | Malaysian |
| Minimum | $29,063 | $18,125 |
| Maximum | $136,135 | $83,750 |
| Range | $107,072 | $65,625 |
| Mean | $62,217 | $50,258 |
| Median | $59,730 | $53,597 |
| Interquartile 25% (IQ1) | $42,874 | $37,943 |
| Interquartile 75% (IQ3) | $73,140 | $59,785 |
| Interquartile Range (IQR) | $30,267 | $21,842 |
| Standard Deviation (Sample) | $24,786 | $13,663 |
| Standard Deviation (Population) | $24,526 | $13,572 |
Similar Demographics by Householder Income Over 65 years
Demographics Similar to Slavs by Householder Income Over 65 years
In terms of householder income over 65 years, the demographic groups most similar to Slavs are Scottish ($61,735, a difference of 0.040%), Hungarian ($61,673, a difference of 0.060%), Armenian ($61,656, a difference of 0.090%), Costa Rican ($61,638, a difference of 0.12%), and Alsatian ($61,797, a difference of 0.14%).
| Demographics | Rating | Rank | Householder Income Over 65 years |
| Immigrants | Belarus | 77.8 /100 | #143 | Good $62,162 |
| Immigrants | Peru | 74.4 /100 | #144 | Good $61,988 |
| Immigrants | Uganda | 74.2 /100 | #145 | Good $61,976 |
| Immigrants | Southern Europe | 72.7 /100 | #146 | Good $61,902 |
| Immigrants | Nepal | 71.4 /100 | #147 | Good $61,843 |
| Alsatians | 70.5 /100 | #148 | Good $61,797 |
| Scottish | 69.1 /100 | #149 | Good $61,735 |
| Slavs | 68.5 /100 | #150 | Good $61,709 |
| Hungarians | 67.7 /100 | #151 | Good $61,673 |
| Armenians | 67.3 /100 | #152 | Good $61,656 |
| Costa Ricans | 66.9 /100 | #153 | Good $61,638 |
| Swiss | 66.5 /100 | #154 | Good $61,621 |
| Poles | 65.9 /100 | #155 | Good $61,598 |
| Scandinavians | 65.6 /100 | #156 | Good $61,586 |
| Macedonians | 65.1 /100 | #157 | Good $61,564 |
Demographics Similar to Malaysians by Householder Income Over 65 years
In terms of householder income over 65 years, the demographic groups most similar to Malaysians are Yugoslavian ($58,243, a difference of 0.0%), Immigrants from El Salvador ($58,226, a difference of 0.030%), Panamanian ($58,266, a difference of 0.040%), Delaware ($58,214, a difference of 0.050%), and Sudanese ($58,281, a difference of 0.060%).
| Demographics | Rating | Rank | Householder Income Over 65 years |
| Colombians | 9.8 /100 | #212 | Tragic $58,851 |
| Whites/Caucasians | 9.8 /100 | #213 | Tragic $58,847 |
| Nepalese | 9.0 /100 | #214 | Tragic $58,761 |
| Immigrants | Ghana | 7.9 /100 | #215 | Tragic $58,624 |
| Immigrants | Middle Africa | 6.2 /100 | #216 | Tragic $58,375 |
| Sudanese | 5.7 /100 | #217 | Tragic $58,281 |
| Panamanians | 5.6 /100 | #218 | Tragic $58,266 |
| Malaysians | 5.5 /100 | #219 | Tragic $58,244 |
| Yugoslavians | 5.5 /100 | #220 | Tragic $58,243 |
| Immigrants | El Salvador | 5.4 /100 | #221 | Tragic $58,226 |
| Delaware | 5.3 /100 | #222 | Tragic $58,214 |
| Tsimshian | 5.2 /100 | #223 | Tragic $58,202 |
| Bermudans | 5.1 /100 | #224 | Tragic $58,171 |
| Venezuelans | 4.4 /100 | #225 | Tragic $58,026 |
| French Canadians | 4.2 /100 | #226 | Tragic $57,975 |