Immigrants from Panama vs Malaysian Householder Income Over 65 years
COMPARE
Immigrants from Panama
Malaysian
Householder Income Over 65 years
Householder Income Over 65 years Comparison
Immigrants from Panama
Malaysians
$56,944
HOUSEHOLDER INCOME OVER 65 YEARS
1.5/ 100
METRIC RATING
237th/ 347
METRIC RANK
$58,244
HOUSEHOLDER INCOME OVER 65 YEARS
5.5/ 100
METRIC RATING
219th/ 347
METRIC RANK
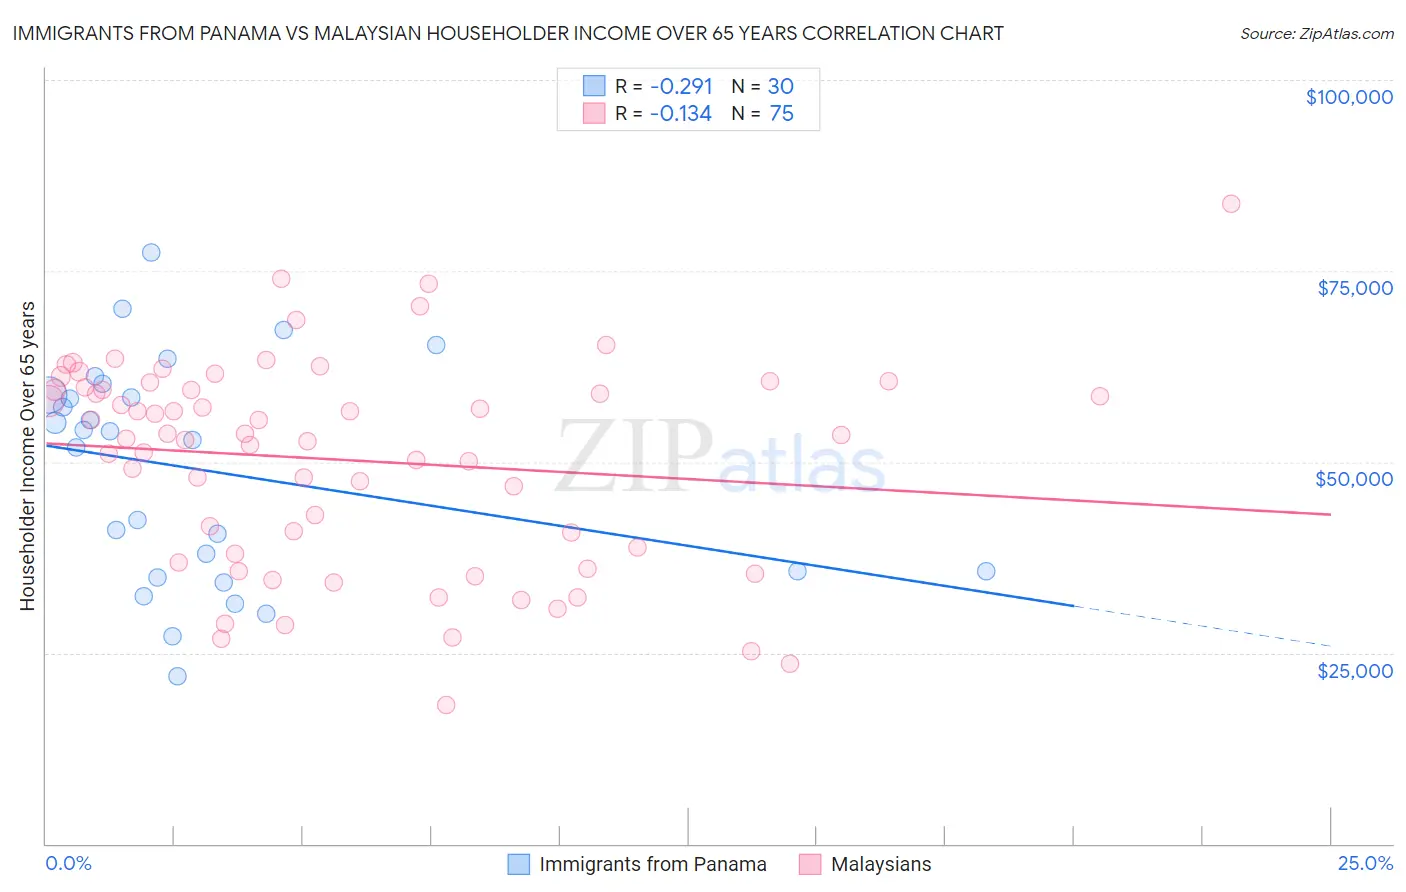
Immigrants from Panama vs Malaysian Householder Income Over 65 years Correlation Chart
The statistical analysis conducted on geographies consisting of 220,881,566 people shows a weak negative correlation between the proportion of Immigrants from Panama and household income with householder over the age of 65 in the United States with a correlation coefficient (R) of -0.291 and weighted average of $56,944. Similarly, the statistical analysis conducted on geographies consisting of 225,600,084 people shows a poor negative correlation between the proportion of Malaysians and household income with householder over the age of 65 in the United States with a correlation coefficient (R) of -0.134 and weighted average of $58,244, a difference of 2.3%.
Householder Income Over 65 years Correlation Summary
| Measurement | Immigrants from Panama | Malaysian |
| Minimum | $21,895 | $18,125 |
| Maximum | $77,384 | $83,750 |
| Range | $55,489 | $65,625 |
| Mean | $48,900 | $50,258 |
| Median | $53,438 | $53,597 |
| Interquartile 25% (IQ1) | $35,664 | $37,943 |
| Interquartile 75% (IQ3) | $58,728 | $59,785 |
| Interquartile Range (IQR) | $23,064 | $21,842 |
| Standard Deviation (Sample) | $14,446 | $13,663 |
| Standard Deviation (Population) | $14,204 | $13,572 |
Demographics Similar to Immigrants from Panama and Malaysians by Householder Income Over 65 years
In terms of householder income over 65 years, the demographic groups most similar to Immigrants from Panama are Immigrants from Uruguay ($56,975, a difference of 0.050%), Spanish American ($57,021, a difference of 0.14%), Immigrants from Burma/Myanmar ($57,114, a difference of 0.30%), Immigrants from Western Africa ($57,119, a difference of 0.31%), and Fijian ($56,768, a difference of 0.31%). Similarly, the demographic groups most similar to Malaysians are Yugoslavian ($58,243, a difference of 0.0%), Immigrants from El Salvador ($58,226, a difference of 0.030%), Panamanian ($58,266, a difference of 0.040%), Delaware ($58,214, a difference of 0.050%), and Tsimshian ($58,202, a difference of 0.070%).
| Demographics | Rating | Rank | Householder Income Over 65 years |
| Panamanians | 5.6 /100 | #218 | Tragic $58,266 |
| Malaysians | 5.5 /100 | #219 | Tragic $58,244 |
| Yugoslavians | 5.5 /100 | #220 | Tragic $58,243 |
| Immigrants | El Salvador | 5.4 /100 | #221 | Tragic $58,226 |
| Delaware | 5.3 /100 | #222 | Tragic $58,214 |
| Tsimshian | 5.2 /100 | #223 | Tragic $58,202 |
| Bermudans | 5.1 /100 | #224 | Tragic $58,171 |
| Venezuelans | 4.4 /100 | #225 | Tragic $58,026 |
| French Canadians | 4.2 /100 | #226 | Tragic $57,975 |
| Japanese | 3.9 /100 | #227 | Tragic $57,919 |
| Immigrants | Albania | 3.6 /100 | #228 | Tragic $57,828 |
| Immigrants | Colombia | 3.0 /100 | #229 | Tragic $57,658 |
| Immigrants | Cambodia | 2.8 /100 | #230 | Tragic $57,580 |
| Immigrants | Nonimmigrants | 2.4 /100 | #231 | Tragic $57,426 |
| Immigrants | Venezuela | 2.3 /100 | #232 | Tragic $57,371 |
| Immigrants | Western Africa | 1.7 /100 | #233 | Tragic $57,119 |
| Immigrants | Burma/Myanmar | 1.7 /100 | #234 | Tragic $57,114 |
| Spanish Americans | 1.6 /100 | #235 | Tragic $57,021 |
| Immigrants | Uruguay | 1.5 /100 | #236 | Tragic $56,975 |
| Immigrants | Panama | 1.5 /100 | #237 | Tragic $56,944 |
| Fijians | 1.2 /100 | #238 | Tragic $56,768 |