Immigrants from Portugal vs Immigrants from Sierra Leone Householder Income Over 65 years
COMPARE
Immigrants from Portugal
Immigrants from Sierra Leone
Householder Income Over 65 years
Householder Income Over 65 years Comparison
Immigrants from Portugal
Immigrants from Sierra Leone
$55,924
HOUSEHOLDER INCOME OVER 65 YEARS
0.5/ 100
METRIC RATING
251st/ 347
METRIC RANK
$66,009
HOUSEHOLDER INCOME OVER 65 YEARS
99.5/ 100
METRIC RATING
62nd/ 347
METRIC RANK
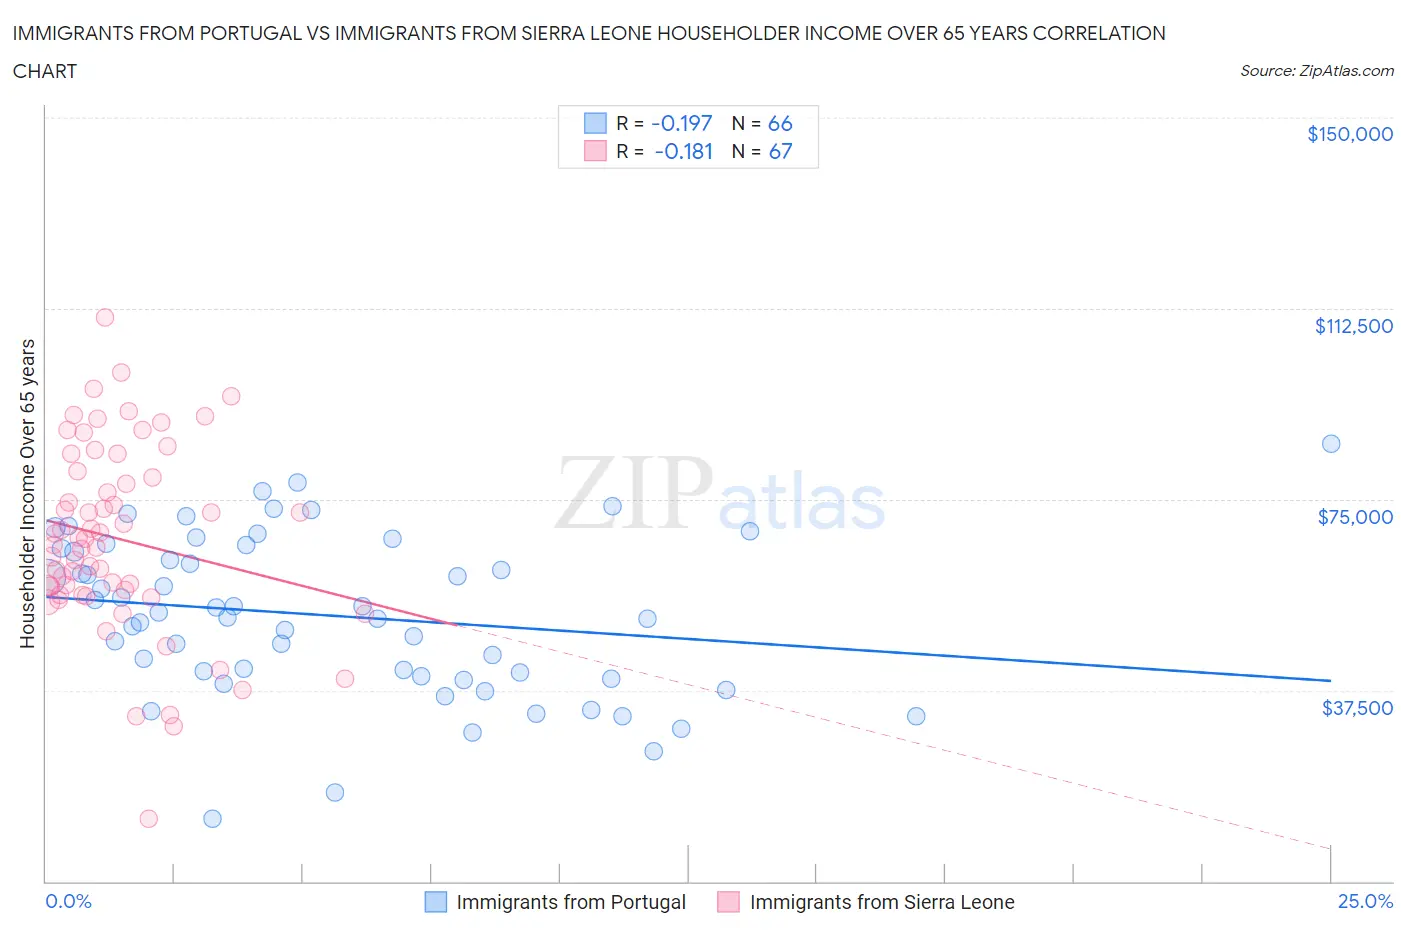
Immigrants from Portugal vs Immigrants from Sierra Leone Householder Income Over 65 years Correlation Chart
The statistical analysis conducted on geographies consisting of 174,564,681 people shows a poor negative correlation between the proportion of Immigrants from Portugal and household income with householder over the age of 65 in the United States with a correlation coefficient (R) of -0.197 and weighted average of $55,924. Similarly, the statistical analysis conducted on geographies consisting of 101,523,996 people shows a poor negative correlation between the proportion of Immigrants from Sierra Leone and household income with householder over the age of 65 in the United States with a correlation coefficient (R) of -0.181 and weighted average of $66,009, a difference of 18.0%.
Householder Income Over 65 years Correlation Summary
| Measurement | Immigrants from Portugal | Immigrants from Sierra Leone |
| Minimum | $12,293 | $12,169 |
| Maximum | $85,927 | $110,741 |
| Range | $73,634 | $98,572 |
| Mean | $52,138 | $67,267 |
| Median | $52,364 | $67,287 |
| Interquartile 25% (IQ1) | $40,233 | $56,276 |
| Interquartile 75% (IQ3) | $65,422 | $80,544 |
| Interquartile Range (IQR) | $25,189 | $24,267 |
| Standard Deviation (Sample) | $15,656 | $18,521 |
| Standard Deviation (Population) | $15,537 | $18,383 |
Similar Demographics by Householder Income Over 65 years
Demographics Similar to Immigrants from Portugal by Householder Income Over 65 years
In terms of householder income over 65 years, the demographic groups most similar to Immigrants from Portugal are Immigrants from Bosnia and Herzegovina ($55,986, a difference of 0.11%), Mexican American Indian ($56,089, a difference of 0.30%), Vietnamese ($56,143, a difference of 0.39%), Osage ($55,677, a difference of 0.44%), and Yakama ($56,234, a difference of 0.55%).
| Demographics | Rating | Rank | Householder Income Over 65 years |
| Hmong | 0.8 /100 | #244 | Tragic $56,339 |
| Immigrants | Uzbekistan | 0.8 /100 | #245 | Tragic $56,331 |
| Central Americans | 0.8 /100 | #246 | Tragic $56,321 |
| Yakama | 0.7 /100 | #247 | Tragic $56,234 |
| Vietnamese | 0.6 /100 | #248 | Tragic $56,143 |
| Mexican American Indians | 0.6 /100 | #249 | Tragic $56,089 |
| Immigrants | Bosnia and Herzegovina | 0.5 /100 | #250 | Tragic $55,986 |
| Immigrants | Portugal | 0.5 /100 | #251 | Tragic $55,924 |
| Osage | 0.4 /100 | #252 | Tragic $55,677 |
| Immigrants | Trinidad and Tobago | 0.4 /100 | #253 | Tragic $55,598 |
| Americans | 0.3 /100 | #254 | Tragic $55,527 |
| Immigrants | Bangladesh | 0.3 /100 | #255 | Tragic $55,394 |
| German Russians | 0.3 /100 | #256 | Tragic $55,356 |
| Trinidadians and Tobagonians | 0.3 /100 | #257 | Tragic $55,327 |
| Ecuadorians | 0.2 /100 | #258 | Tragic $54,958 |
Demographics Similar to Immigrants from Sierra Leone by Householder Income Over 65 years
In terms of householder income over 65 years, the demographic groups most similar to Immigrants from Sierra Leone are Maltese ($66,027, a difference of 0.030%), Immigrants from Lithuania ($66,087, a difference of 0.12%), Immigrants from Norway ($66,118, a difference of 0.17%), Marshallese ($65,874, a difference of 0.21%), and Immigrants from Philippines ($66,161, a difference of 0.23%).
| Demographics | Rating | Rank | Householder Income Over 65 years |
| Immigrants | Czechoslovakia | 99.7 /100 | #55 | Exceptional $66,376 |
| Laotians | 99.6 /100 | #56 | Exceptional $66,306 |
| Bulgarians | 99.6 /100 | #57 | Exceptional $66,236 |
| Immigrants | Philippines | 99.6 /100 | #58 | Exceptional $66,161 |
| Immigrants | Norway | 99.5 /100 | #59 | Exceptional $66,118 |
| Immigrants | Lithuania | 99.5 /100 | #60 | Exceptional $66,087 |
| Maltese | 99.5 /100 | #61 | Exceptional $66,027 |
| Immigrants | Sierra Leone | 99.5 /100 | #62 | Exceptional $66,009 |
| Marshallese | 99.4 /100 | #63 | Exceptional $65,874 |
| Zimbabweans | 99.4 /100 | #64 | Exceptional $65,854 |
| Immigrants | England | 99.3 /100 | #65 | Exceptional $65,715 |
| South Africans | 99.3 /100 | #66 | Exceptional $65,652 |
| Immigrants | Malaysia | 99.1 /100 | #67 | Exceptional $65,497 |
| Egyptians | 99.1 /100 | #68 | Exceptional $65,441 |
| Samoans | 99.1 /100 | #69 | Exceptional $65,427 |