Tohono O'odham vs Immigrants from Sierra Leone Single Father Households
COMPARE
Tohono O'odham
Immigrants from Sierra Leone
Single Father Households
Single Father Households Comparison
Tohono O'odham
Immigrants from Sierra Leone
3.8%
SINGLE FATHER HOUSEHOLDS
0.0/ 100
METRIC RATING
342nd/ 347
METRIC RANK
2.5%
SINGLE FATHER HOUSEHOLDS
5.8/ 100
METRIC RATING
238th/ 347
METRIC RANK
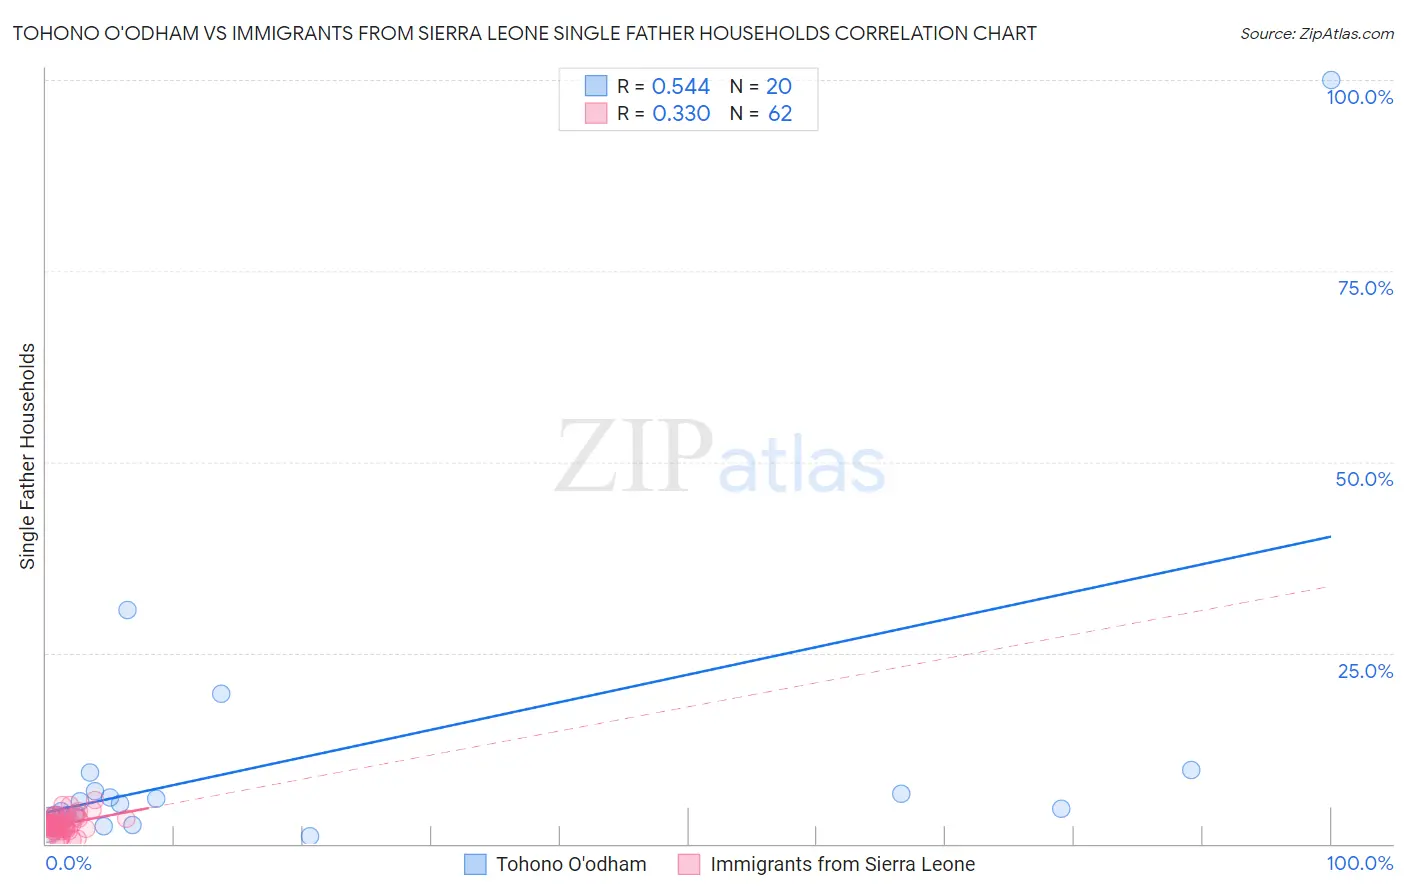
Tohono O'odham vs Immigrants from Sierra Leone Single Father Households Correlation Chart
The statistical analysis conducted on geographies consisting of 58,632,927 people shows a substantial positive correlation between the proportion of Tohono O'odham and percentage of single father households in the United States with a correlation coefficient (R) of 0.544 and weighted average of 3.8%. Similarly, the statistical analysis conducted on geographies consisting of 101,470,770 people shows a mild positive correlation between the proportion of Immigrants from Sierra Leone and percentage of single father households in the United States with a correlation coefficient (R) of 0.330 and weighted average of 2.5%, a difference of 55.6%.
Single Father Households Correlation Summary
| Measurement | Tohono O'odham | Immigrants from Sierra Leone |
| Minimum | 1.0% | 0.47% |
| Maximum | 100.0% | 5.7% |
| Range | 99.0% | 5.3% |
| Mean | 11.7% | 2.5% |
| Median | 5.4% | 2.4% |
| Interquartile 25% (IQ1) | 3.8% | 2.1% |
| Interquartile 75% (IQ3) | 8.1% | 2.9% |
| Interquartile Range (IQR) | 4.3% | 0.83% |
| Standard Deviation (Sample) | 21.9% | 1.0% |
| Standard Deviation (Population) | 21.3% | 1.0% |
Similar Demographics by Single Father Households
Demographics Similar to Tohono O'odham by Single Father Households
In terms of single father households, the demographic groups most similar to Tohono O'odham are Crow (3.5%, a difference of 8.8%), Alaska Native (3.5%, a difference of 9.1%), Pima (4.2%, a difference of 9.2%), Yakama (4.2%, a difference of 9.5%), and Menominee (4.2%, a difference of 10.2%).
| Demographics | Rating | Rank | Single Father Households |
| Natives/Alaskans | 0.0 /100 | #333 | Tragic 3.2% |
| Yuman | 0.0 /100 | #334 | Tragic 3.3% |
| Colville | 0.0 /100 | #335 | Tragic 3.3% |
| Paiute | 0.0 /100 | #336 | Tragic 3.3% |
| Pueblo | 0.0 /100 | #337 | Tragic 3.3% |
| Sioux | 0.0 /100 | #338 | Tragic 3.3% |
| Alaskan Athabascans | 0.0 /100 | #339 | Tragic 3.4% |
| Alaska Natives | 0.0 /100 | #340 | Tragic 3.5% |
| Crow | 0.0 /100 | #341 | Tragic 3.5% |
| Tohono O'odham | 0.0 /100 | #342 | Tragic 3.8% |
| Pima | 0.0 /100 | #343 | Tragic 4.2% |
| Yakama | 0.0 /100 | #344 | Tragic 4.2% |
| Menominee | 0.0 /100 | #345 | Tragic 4.2% |
| Inupiat | 0.0 /100 | #346 | Tragic 4.9% |
| Yup'ik | 0.0 /100 | #347 | Tragic 5.4% |
Demographics Similar to Immigrants from Sierra Leone by Single Father Households
In terms of single father households, the demographic groups most similar to Immigrants from Sierra Leone are Immigrants from Oceania (2.5%, a difference of 0.010%), Sierra Leonean (2.5%, a difference of 0.030%), Cajun (2.5%, a difference of 0.080%), Immigrants (2.5%, a difference of 0.13%), and African (2.5%, a difference of 0.15%).
| Demographics | Rating | Rank | Single Father Households |
| Immigrants | Nonimmigrants | 7.6 /100 | #231 | Tragic 2.4% |
| Pennsylvania Germans | 7.3 /100 | #232 | Tragic 2.4% |
| Immigrants | Western Africa | 7.0 /100 | #233 | Tragic 2.4% |
| Africans | 6.3 /100 | #234 | Tragic 2.5% |
| Immigrants | Immigrants | 6.3 /100 | #235 | Tragic 2.5% |
| Cajuns | 6.1 /100 | #236 | Tragic 2.5% |
| Sierra Leoneans | 5.9 /100 | #237 | Tragic 2.5% |
| Immigrants | Sierra Leone | 5.8 /100 | #238 | Tragic 2.5% |
| Immigrants | Oceania | 5.8 /100 | #239 | Tragic 2.5% |
| Immigrants | Dominica | 4.8 /100 | #240 | Tragic 2.5% |
| Portuguese | 4.1 /100 | #241 | Tragic 2.5% |
| Osage | 4.1 /100 | #242 | Tragic 2.5% |
| Spaniards | 3.1 /100 | #243 | Tragic 2.5% |
| Immigrants | Middle Africa | 2.8 /100 | #244 | Tragic 2.5% |
| Basques | 2.5 /100 | #245 | Tragic 2.5% |