Tohono O'odham vs Salvadoran Median Male Earnings
COMPARE
Tohono O'odham
Salvadoran
Median Male Earnings
Median Male Earnings Comparison
Tohono O'odham
Salvadorans
$39,543
MEDIAN MALE EARNINGS
0.0/ 100
METRIC RATING
346th/ 347
METRIC RANK
$48,646
MEDIAN MALE EARNINGS
0.3/ 100
METRIC RATING
272nd/ 347
METRIC RANK
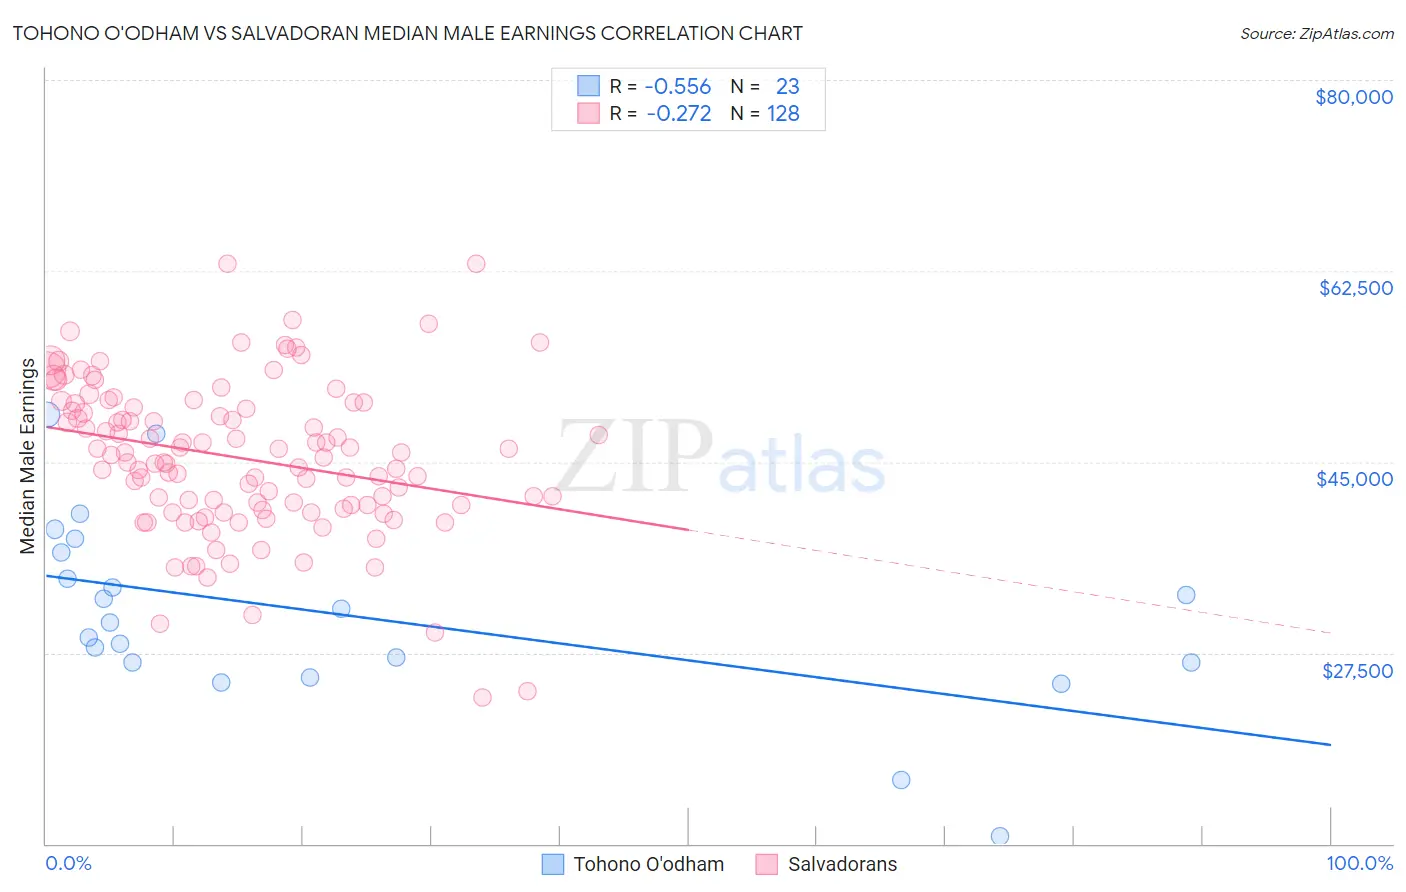
Tohono O'odham vs Salvadoran Median Male Earnings Correlation Chart
The statistical analysis conducted on geographies consisting of 58,721,947 people shows a substantial negative correlation between the proportion of Tohono O'odham and median male earnings in the United States with a correlation coefficient (R) of -0.556 and weighted average of $39,543. Similarly, the statistical analysis conducted on geographies consisting of 398,918,079 people shows a weak negative correlation between the proportion of Salvadorans and median male earnings in the United States with a correlation coefficient (R) of -0.272 and weighted average of $48,646, a difference of 23.0%.
Median Male Earnings Correlation Summary
| Measurement | Tohono O'odham | Salvadoran |
| Minimum | $10,662 | $23,439 |
| Maximum | $49,303 | $63,214 |
| Range | $38,641 | $39,775 |
| Mean | $30,964 | $45,362 |
| Median | $30,247 | $45,515 |
| Interquartile 25% (IQ1) | $26,584 | $40,883 |
| Interquartile 75% (IQ3) | $36,724 | $50,182 |
| Interquartile Range (IQR) | $10,140 | $9,299 |
| Standard Deviation (Sample) | $8,763 | $7,004 |
| Standard Deviation (Population) | $8,570 | $6,977 |
Similar Demographics by Median Male Earnings
Demographics Similar to Tohono O'odham by Median Male Earnings
In terms of median male earnings, the demographic groups most similar to Tohono O'odham are Yup'ik ($39,504, a difference of 0.10%), Puerto Rican ($40,071, a difference of 1.3%), Pueblo ($41,314, a difference of 4.5%), Lumbee ($41,715, a difference of 5.5%), and Arapaho ($41,758, a difference of 5.6%).
| Demographics | Rating | Rank | Median Male Earnings |
| Immigrants | Congo | 0.0 /100 | #333 | Tragic $44,204 |
| Immigrants | Yemen | 0.0 /100 | #334 | Tragic $44,083 |
| Spanish American Indians | 0.0 /100 | #335 | Tragic $44,010 |
| Immigrants | Cuba | 0.0 /100 | #336 | Tragic $43,461 |
| Menominee | 0.0 /100 | #337 | Tragic $42,581 |
| Crow | 0.0 /100 | #338 | Tragic $42,434 |
| Pima | 0.0 /100 | #339 | Tragic $42,357 |
| Navajo | 0.0 /100 | #340 | Tragic $42,098 |
| Hopi | 0.0 /100 | #341 | Tragic $42,060 |
| Arapaho | 0.0 /100 | #342 | Tragic $41,758 |
| Lumbee | 0.0 /100 | #343 | Tragic $41,715 |
| Pueblo | 0.0 /100 | #344 | Tragic $41,314 |
| Puerto Ricans | 0.0 /100 | #345 | Tragic $40,071 |
| Tohono O'odham | 0.0 /100 | #346 | Tragic $39,543 |
| Yup'ik | 0.0 /100 | #347 | Tragic $39,504 |
Demographics Similar to Salvadorans by Median Male Earnings
In terms of median male earnings, the demographic groups most similar to Salvadorans are Jamaican ($48,632, a difference of 0.030%), Cherokee ($48,669, a difference of 0.050%), Potawatomi ($48,768, a difference of 0.25%), Colville ($48,516, a difference of 0.27%), and Tsimshian ($48,836, a difference of 0.39%).
| Demographics | Rating | Rank | Median Male Earnings |
| Immigrants | Laos | 0.6 /100 | #265 | Tragic $49,190 |
| Somalis | 0.5 /100 | #266 | Tragic $49,025 |
| Spanish Americans | 0.5 /100 | #267 | Tragic $49,008 |
| Ute | 0.4 /100 | #268 | Tragic $48,899 |
| Tsimshian | 0.4 /100 | #269 | Tragic $48,836 |
| Potawatomi | 0.4 /100 | #270 | Tragic $48,768 |
| Cherokee | 0.3 /100 | #271 | Tragic $48,669 |
| Salvadorans | 0.3 /100 | #272 | Tragic $48,646 |
| Jamaicans | 0.3 /100 | #273 | Tragic $48,632 |
| Colville | 0.3 /100 | #274 | Tragic $48,516 |
| Immigrants | Somalia | 0.3 /100 | #275 | Tragic $48,439 |
| Blackfeet | 0.3 /100 | #276 | Tragic $48,402 |
| Belizeans | 0.2 /100 | #277 | Tragic $48,358 |
| Immigrants | Liberia | 0.2 /100 | #278 | Tragic $48,317 |
| Hmong | 0.2 /100 | #279 | Tragic $48,254 |