Tohono O'odham vs British Median Male Earnings
COMPARE
Tohono O'odham
British
Median Male Earnings
Median Male Earnings Comparison
Tohono O'odham
British
$39,543
MEDIAN MALE EARNINGS
0.0/ 100
METRIC RATING
346th/ 347
METRIC RANK
$57,890
MEDIAN MALE EARNINGS
96.5/ 100
METRIC RATING
109th/ 347
METRIC RANK
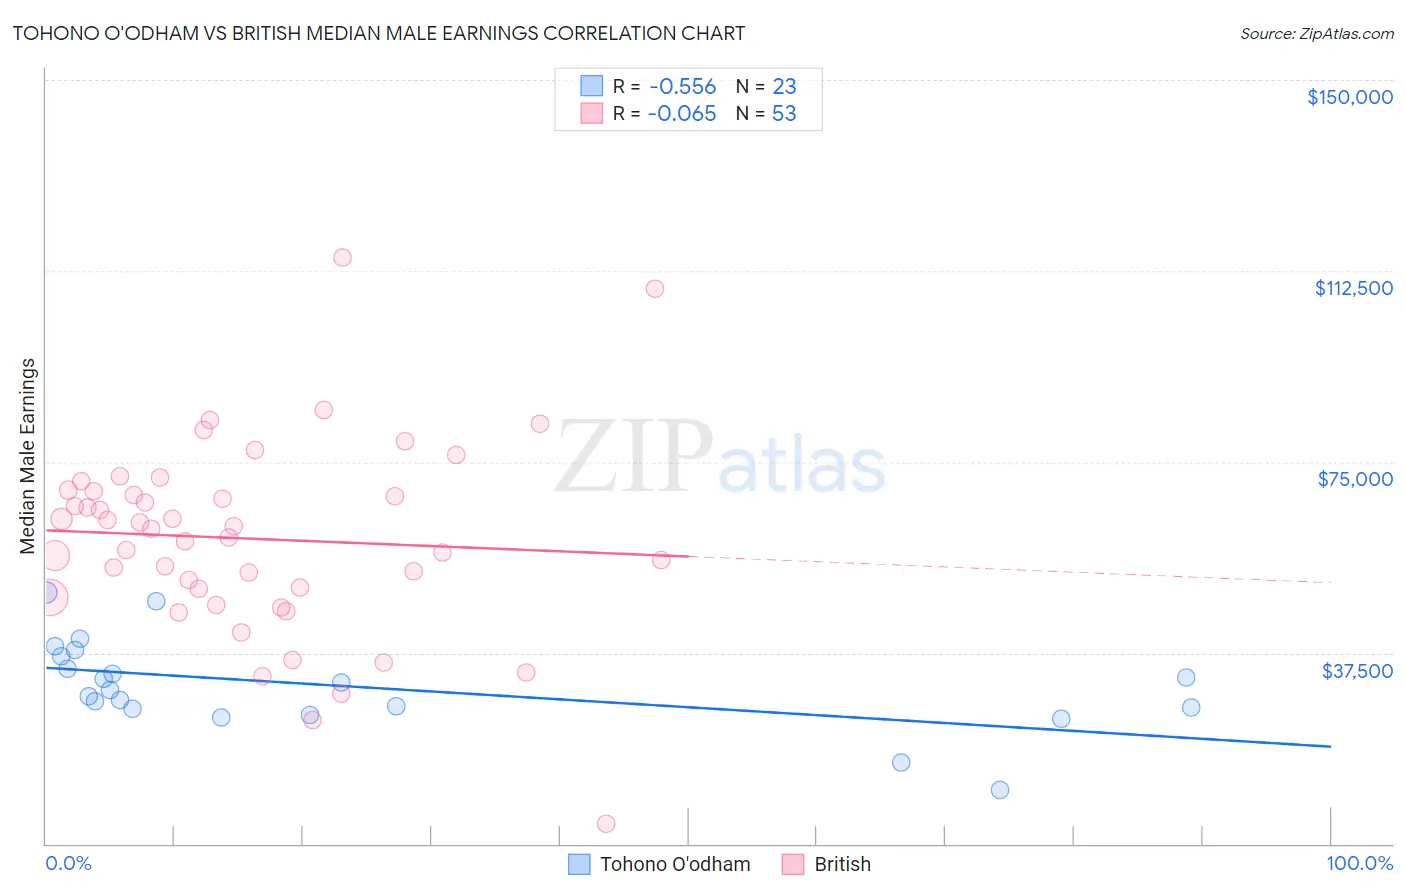
Tohono O'odham vs British Median Male Earnings Correlation Chart
The statistical analysis conducted on geographies consisting of 58,721,947 people shows a substantial negative correlation between the proportion of Tohono O'odham and median male earnings in the United States with a correlation coefficient (R) of -0.556 and weighted average of $39,543. Similarly, the statistical analysis conducted on geographies consisting of 530,851,960 people shows a slight negative correlation between the proportion of British and median male earnings in the United States with a correlation coefficient (R) of -0.065 and weighted average of $57,890, a difference of 46.4%.
Median Male Earnings Correlation Summary
| Measurement | Tohono O'odham | British |
| Minimum | $10,662 | $3,957 |
| Maximum | $49,303 | $115,192 |
| Range | $38,641 | $111,235 |
| Mean | $30,964 | $59,934 |
| Median | $30,247 | $61,983 |
| Interquartile 25% (IQ1) | $26,584 | $49,275 |
| Interquartile 75% (IQ3) | $36,724 | $69,382 |
| Interquartile Range (IQR) | $10,140 | $20,107 |
| Standard Deviation (Sample) | $8,763 | $19,214 |
| Standard Deviation (Population) | $8,570 | $19,032 |
Similar Demographics by Median Male Earnings
Demographics Similar to Tohono O'odham by Median Male Earnings
In terms of median male earnings, the demographic groups most similar to Tohono O'odham are Yup'ik ($39,504, a difference of 0.10%), Puerto Rican ($40,071, a difference of 1.3%), Pueblo ($41,314, a difference of 4.5%), Lumbee ($41,715, a difference of 5.5%), and Arapaho ($41,758, a difference of 5.6%).
| Demographics | Rating | Rank | Median Male Earnings |
| Immigrants | Congo | 0.0 /100 | #333 | Tragic $44,204 |
| Immigrants | Yemen | 0.0 /100 | #334 | Tragic $44,083 |
| Spanish American Indians | 0.0 /100 | #335 | Tragic $44,010 |
| Immigrants | Cuba | 0.0 /100 | #336 | Tragic $43,461 |
| Menominee | 0.0 /100 | #337 | Tragic $42,581 |
| Crow | 0.0 /100 | #338 | Tragic $42,434 |
| Pima | 0.0 /100 | #339 | Tragic $42,357 |
| Navajo | 0.0 /100 | #340 | Tragic $42,098 |
| Hopi | 0.0 /100 | #341 | Tragic $42,060 |
| Arapaho | 0.0 /100 | #342 | Tragic $41,758 |
| Lumbee | 0.0 /100 | #343 | Tragic $41,715 |
| Pueblo | 0.0 /100 | #344 | Tragic $41,314 |
| Puerto Ricans | 0.0 /100 | #345 | Tragic $40,071 |
| Tohono O'odham | 0.0 /100 | #346 | Tragic $39,543 |
| Yup'ik | 0.0 /100 | #347 | Tragic $39,504 |
Demographics Similar to British by Median Male Earnings
In terms of median male earnings, the demographic groups most similar to British are Immigrants from Uzbekistan ($57,941, a difference of 0.090%), Serbian ($57,975, a difference of 0.15%), Palestinian ($57,778, a difference of 0.19%), Immigrants from Northern Africa ($58,008, a difference of 0.20%), and Armenian ($58,134, a difference of 0.42%).
| Demographics | Rating | Rank | Median Male Earnings |
| Syrians | 97.4 /100 | #102 | Exceptional $58,187 |
| Poles | 97.3 /100 | #103 | Exceptional $58,139 |
| Armenians | 97.3 /100 | #104 | Exceptional $58,134 |
| Immigrants | Western Asia | 97.3 /100 | #105 | Exceptional $58,131 |
| Immigrants | Northern Africa | 96.9 /100 | #106 | Exceptional $58,008 |
| Serbians | 96.8 /100 | #107 | Exceptional $57,975 |
| Immigrants | Uzbekistan | 96.7 /100 | #108 | Exceptional $57,941 |
| British | 96.5 /100 | #109 | Exceptional $57,890 |
| Palestinians | 96.2 /100 | #110 | Exceptional $57,778 |
| Europeans | 95.6 /100 | #111 | Exceptional $57,637 |
| Immigrants | Afghanistan | 95.4 /100 | #112 | Exceptional $57,582 |
| Carpatho Rusyns | 95.3 /100 | #113 | Exceptional $57,572 |
| Immigrants | Kuwait | 95.3 /100 | #114 | Exceptional $57,562 |
| Swedes | 94.8 /100 | #115 | Exceptional $57,445 |
| Lebanese | 94.6 /100 | #116 | Exceptional $57,409 |