Tohono O'odham vs Immigrants from Costa Rica Per Capita Income
COMPARE
Tohono O'odham
Immigrants from Costa Rica
Per Capita Income
Per Capita Income Comparison
Tohono O'odham
Immigrants from Costa Rica
$30,256
PER CAPITA INCOME
0.0/ 100
METRIC RATING
345th/ 347
METRIC RANK
$43,464
PER CAPITA INCOME
44.5/ 100
METRIC RATING
178th/ 347
METRIC RANK
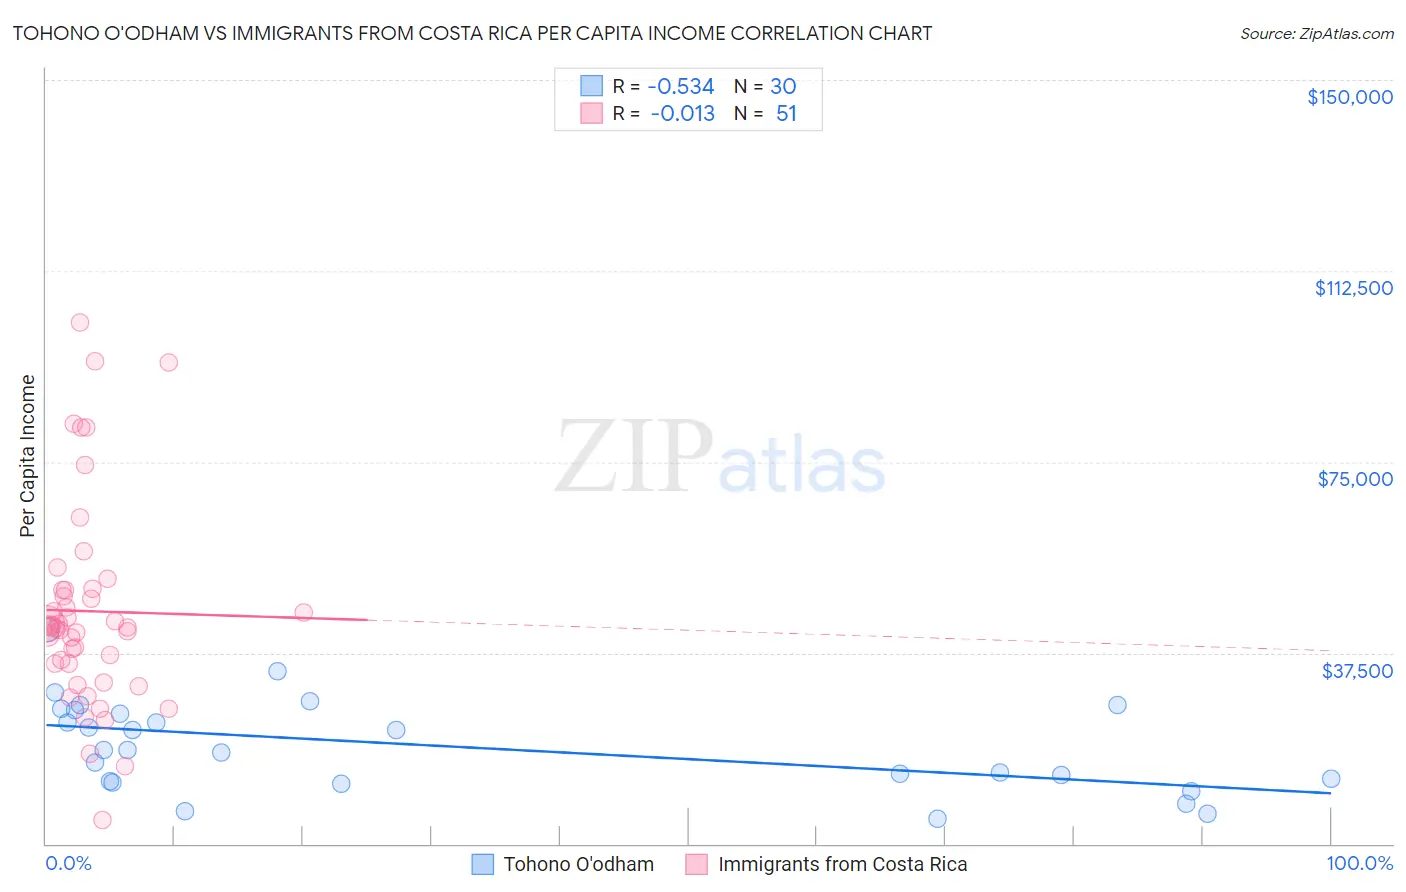
Tohono O'odham vs Immigrants from Costa Rica Per Capita Income Correlation Chart
The statistical analysis conducted on geographies consisting of 58,730,368 people shows a substantial negative correlation between the proportion of Tohono O'odham and per capita income in the United States with a correlation coefficient (R) of -0.534 and weighted average of $30,256. Similarly, the statistical analysis conducted on geographies consisting of 204,277,265 people shows no correlation between the proportion of Immigrants from Costa Rica and per capita income in the United States with a correlation coefficient (R) of -0.013 and weighted average of $43,464, a difference of 43.6%.
Per Capita Income Correlation Summary
| Measurement | Tohono O'odham | Immigrants from Costa Rica |
| Minimum | $4,874 | $4,614 |
| Maximum | $41,987 | $102,492 |
| Range | $37,113 | $97,878 |
| Mean | $19,246 | $45,686 |
| Median | $18,448 | $42,626 |
| Interquartile 25% (IQ1) | $12,324 | $35,269 |
| Interquartile 75% (IQ3) | $26,227 | $49,864 |
| Interquartile Range (IQR) | $13,903 | $14,595 |
| Standard Deviation (Sample) | $8,934 | $20,176 |
| Standard Deviation (Population) | $8,784 | $19,977 |
Similar Demographics by Per Capita Income
Demographics Similar to Tohono O'odham by Per Capita Income
In terms of per capita income, the demographic groups most similar to Tohono O'odham are Yup'ik ($30,518, a difference of 0.87%), Pima ($30,644, a difference of 1.3%), Lumbee ($29,845, a difference of 1.4%), Hopi ($31,177, a difference of 3.0%), and Puerto Rican ($31,268, a difference of 3.4%).
| Demographics | Rating | Rank | Per Capita Income |
| Immigrants | Yemen | 0.0 /100 | #333 | Tragic $33,696 |
| Natives/Alaskans | 0.0 /100 | #334 | Tragic $33,279 |
| Yuman | 0.0 /100 | #335 | Tragic $33,236 |
| Yakama | 0.0 /100 | #336 | Tragic $33,009 |
| Houma | 0.0 /100 | #337 | Tragic $32,996 |
| Arapaho | 0.0 /100 | #338 | Tragic $32,345 |
| Pueblo | 0.0 /100 | #339 | Tragic $32,012 |
| Crow | 0.0 /100 | #340 | Tragic $31,729 |
| Puerto Ricans | 0.0 /100 | #341 | Tragic $31,268 |
| Hopi | 0.0 /100 | #342 | Tragic $31,177 |
| Pima | 0.0 /100 | #343 | Tragic $30,644 |
| Yup'ik | 0.0 /100 | #344 | Tragic $30,518 |
| Tohono O'odham | 0.0 /100 | #345 | Tragic $30,256 |
| Lumbee | 0.0 /100 | #346 | Tragic $29,845 |
| Navajo | 0.0 /100 | #347 | Tragic $29,031 |
Demographics Similar to Immigrants from Costa Rica by Per Capita Income
In terms of per capita income, the demographic groups most similar to Immigrants from Costa Rica are Finnish ($43,461, a difference of 0.010%), Tlingit-Haida ($43,516, a difference of 0.12%), Sierra Leonean ($43,405, a difference of 0.14%), Immigrants from South Eastern Asia ($43,539, a difference of 0.17%), and Celtic ($43,621, a difference of 0.36%).
| Demographics | Rating | Rank | Per Capita Income |
| Immigrants | Eastern Africa | 54.9 /100 | #171 | Average $43,838 |
| Czechoslovakians | 54.1 /100 | #172 | Average $43,806 |
| French | 50.7 /100 | #173 | Average $43,685 |
| Colombians | 50.0 /100 | #174 | Average $43,661 |
| Celtics | 48.9 /100 | #175 | Average $43,621 |
| Immigrants | South Eastern Asia | 46.6 /100 | #176 | Average $43,539 |
| Tlingit-Haida | 45.9 /100 | #177 | Average $43,516 |
| Immigrants | Costa Rica | 44.5 /100 | #178 | Average $43,464 |
| Finns | 44.4 /100 | #179 | Average $43,461 |
| Sierra Leoneans | 42.9 /100 | #180 | Average $43,405 |
| Welsh | 38.2 /100 | #181 | Fair $43,233 |
| Immigrants | Vietnam | 38.1 /100 | #182 | Fair $43,229 |
| Germans | 33.9 /100 | #183 | Fair $43,067 |
| Spaniards | 32.9 /100 | #184 | Fair $43,028 |
| Immigrants | Immigrants | 32.5 /100 | #185 | Fair $43,010 |