French Canadian vs Immigrants from Costa Rica Per Capita Income
COMPARE
French Canadian
Immigrants from Costa Rica
Per Capita Income
Per Capita Income Comparison
French Canadians
Immigrants from Costa Rica
$43,003
PER CAPITA INCOME
32.3/ 100
METRIC RATING
186th/ 347
METRIC RANK
$43,464
PER CAPITA INCOME
44.5/ 100
METRIC RATING
178th/ 347
METRIC RANK
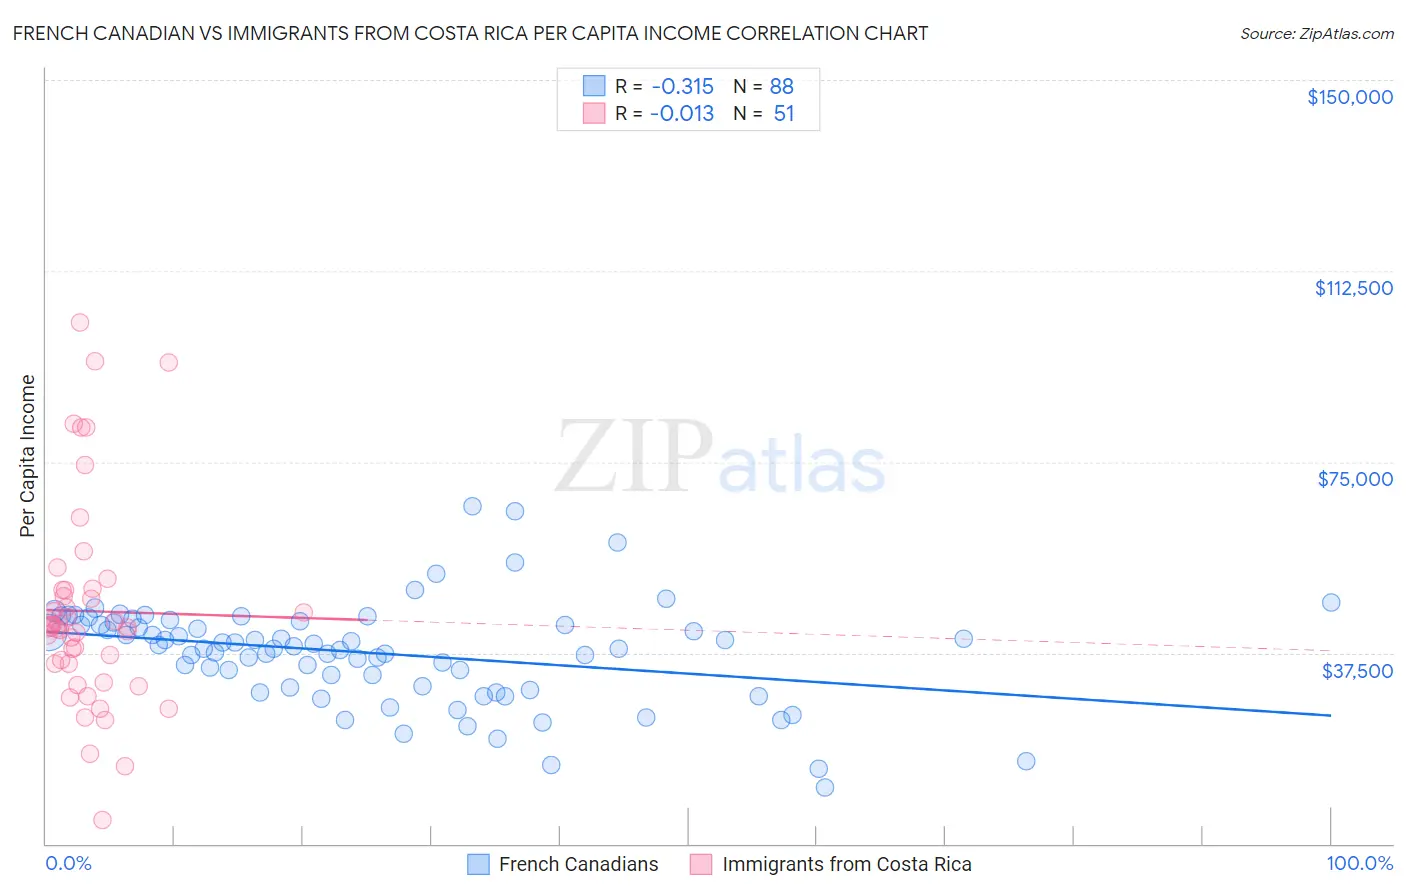
French Canadian vs Immigrants from Costa Rica Per Capita Income Correlation Chart
The statistical analysis conducted on geographies consisting of 502,704,545 people shows a mild negative correlation between the proportion of French Canadians and per capita income in the United States with a correlation coefficient (R) of -0.315 and weighted average of $43,003. Similarly, the statistical analysis conducted on geographies consisting of 204,277,265 people shows no correlation between the proportion of Immigrants from Costa Rica and per capita income in the United States with a correlation coefficient (R) of -0.013 and weighted average of $43,464, a difference of 1.1%.
Per Capita Income Correlation Summary
| Measurement | French Canadian | Immigrants from Costa Rica |
| Minimum | $10,964 | $4,614 |
| Maximum | $66,177 | $102,492 |
| Range | $55,213 | $97,878 |
| Mean | $37,443 | $45,686 |
| Median | $38,631 | $42,626 |
| Interquartile 25% (IQ1) | $30,758 | $35,269 |
| Interquartile 75% (IQ3) | $43,262 | $49,864 |
| Interquartile Range (IQR) | $12,504 | $14,595 |
| Standard Deviation (Sample) | $9,955 | $20,176 |
| Standard Deviation (Population) | $9,898 | $19,977 |
Demographics Similar to French Canadians and Immigrants from Costa Rica by Per Capita Income
In terms of per capita income, the demographic groups most similar to French Canadians are Immigrants ($43,010, a difference of 0.020%), Spaniard ($43,028, a difference of 0.060%), Immigrants from Colombia ($42,971, a difference of 0.070%), Immigrants from Africa ($42,950, a difference of 0.12%), and German ($43,067, a difference of 0.15%). Similarly, the demographic groups most similar to Immigrants from Costa Rica are Finnish ($43,461, a difference of 0.010%), Tlingit-Haida ($43,516, a difference of 0.12%), Sierra Leonean ($43,405, a difference of 0.14%), Immigrants from South Eastern Asia ($43,539, a difference of 0.17%), and Celtic ($43,621, a difference of 0.36%).
| Demographics | Rating | Rank | Per Capita Income |
| Czechoslovakians | 54.1 /100 | #172 | Average $43,806 |
| French | 50.7 /100 | #173 | Average $43,685 |
| Colombians | 50.0 /100 | #174 | Average $43,661 |
| Celtics | 48.9 /100 | #175 | Average $43,621 |
| Immigrants | South Eastern Asia | 46.6 /100 | #176 | Average $43,539 |
| Tlingit-Haida | 45.9 /100 | #177 | Average $43,516 |
| Immigrants | Costa Rica | 44.5 /100 | #178 | Average $43,464 |
| Finns | 44.4 /100 | #179 | Average $43,461 |
| Sierra Leoneans | 42.9 /100 | #180 | Average $43,405 |
| Welsh | 38.2 /100 | #181 | Fair $43,233 |
| Immigrants | Vietnam | 38.1 /100 | #182 | Fair $43,229 |
| Germans | 33.9 /100 | #183 | Fair $43,067 |
| Spaniards | 32.9 /100 | #184 | Fair $43,028 |
| Immigrants | Immigrants | 32.5 /100 | #185 | Fair $43,010 |
| French Canadians | 32.3 /100 | #186 | Fair $43,003 |
| Immigrants | Colombia | 31.5 /100 | #187 | Fair $42,971 |
| Immigrants | Africa | 31.0 /100 | #188 | Fair $42,950 |
| Bermudans | 30.1 /100 | #189 | Fair $42,911 |
| Kenyans | 27.7 /100 | #190 | Fair $42,808 |
| Yugoslavians | 27.4 /100 | #191 | Fair $42,792 |
| Iraqis | 26.7 /100 | #192 | Fair $42,760 |