Tohono O'odham vs Guamanian/Chamorro Per Capita Income
COMPARE
Tohono O'odham
Guamanian/Chamorro
Per Capita Income
Per Capita Income Comparison
Tohono O'odham
Guamanians/Chamorros
$30,256
PER CAPITA INCOME
0.0/ 100
METRIC RATING
345th/ 347
METRIC RANK
$41,678
PER CAPITA INCOME
9.7/ 100
METRIC RATING
217th/ 347
METRIC RANK
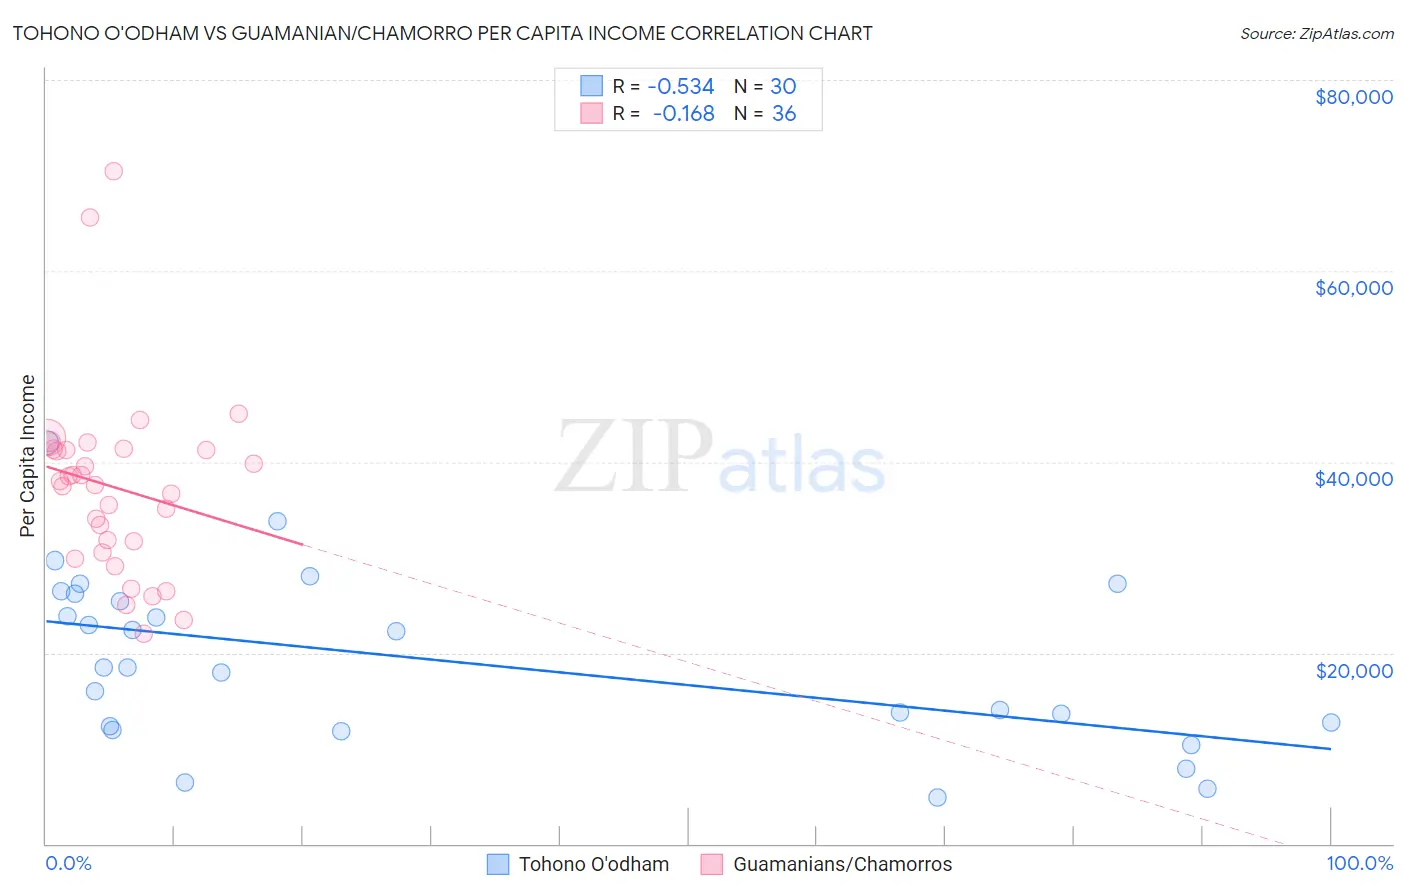
Tohono O'odham vs Guamanian/Chamorro Per Capita Income Correlation Chart
The statistical analysis conducted on geographies consisting of 58,730,368 people shows a substantial negative correlation between the proportion of Tohono O'odham and per capita income in the United States with a correlation coefficient (R) of -0.534 and weighted average of $30,256. Similarly, the statistical analysis conducted on geographies consisting of 221,916,418 people shows a poor negative correlation between the proportion of Guamanians/Chamorros and per capita income in the United States with a correlation coefficient (R) of -0.168 and weighted average of $41,678, a difference of 37.8%.
Per Capita Income Correlation Summary
| Measurement | Tohono O'odham | Guamanian/Chamorro |
| Minimum | $4,874 | $21,937 |
| Maximum | $41,987 | $70,391 |
| Range | $37,113 | $48,454 |
| Mean | $19,246 | $37,325 |
| Median | $18,448 | $37,776 |
| Interquartile 25% (IQ1) | $12,324 | $31,068 |
| Interquartile 75% (IQ3) | $26,227 | $41,275 |
| Interquartile Range (IQR) | $13,903 | $10,207 |
| Standard Deviation (Sample) | $8,934 | $9,827 |
| Standard Deviation (Population) | $8,784 | $9,689 |
Similar Demographics by Per Capita Income
Demographics Similar to Tohono O'odham by Per Capita Income
In terms of per capita income, the demographic groups most similar to Tohono O'odham are Yup'ik ($30,518, a difference of 0.87%), Pima ($30,644, a difference of 1.3%), Lumbee ($29,845, a difference of 1.4%), Hopi ($31,177, a difference of 3.0%), and Puerto Rican ($31,268, a difference of 3.4%).
| Demographics | Rating | Rank | Per Capita Income |
| Immigrants | Yemen | 0.0 /100 | #333 | Tragic $33,696 |
| Natives/Alaskans | 0.0 /100 | #334 | Tragic $33,279 |
| Yuman | 0.0 /100 | #335 | Tragic $33,236 |
| Yakama | 0.0 /100 | #336 | Tragic $33,009 |
| Houma | 0.0 /100 | #337 | Tragic $32,996 |
| Arapaho | 0.0 /100 | #338 | Tragic $32,345 |
| Pueblo | 0.0 /100 | #339 | Tragic $32,012 |
| Crow | 0.0 /100 | #340 | Tragic $31,729 |
| Puerto Ricans | 0.0 /100 | #341 | Tragic $31,268 |
| Hopi | 0.0 /100 | #342 | Tragic $31,177 |
| Pima | 0.0 /100 | #343 | Tragic $30,644 |
| Yup'ik | 0.0 /100 | #344 | Tragic $30,518 |
| Tohono O'odham | 0.0 /100 | #345 | Tragic $30,256 |
| Lumbee | 0.0 /100 | #346 | Tragic $29,845 |
| Navajo | 0.0 /100 | #347 | Tragic $29,031 |
Demographics Similar to Guamanians/Chamorros by Per Capita Income
In terms of per capita income, the demographic groups most similar to Guamanians/Chamorros are Tongan ($41,693, a difference of 0.030%), Sudanese ($41,695, a difference of 0.040%), Trinidadian and Tobagonian ($41,655, a difference of 0.060%), Immigrants from Bangladesh ($41,709, a difference of 0.070%), and Immigrants from Venezuela ($41,727, a difference of 0.12%).
| Demographics | Rating | Rank | Per Capita Income |
| Ecuadorians | 12.9 /100 | #210 | Poor $41,958 |
| Immigrants | Panama | 11.6 /100 | #211 | Poor $41,853 |
| Immigrants | Senegal | 11.3 /100 | #212 | Poor $41,830 |
| Immigrants | Venezuela | 10.2 /100 | #213 | Poor $41,727 |
| Immigrants | Bangladesh | 10.1 /100 | #214 | Poor $41,709 |
| Sudanese | 9.9 /100 | #215 | Tragic $41,695 |
| Tongans | 9.9 /100 | #216 | Tragic $41,693 |
| Guamanians/Chamorros | 9.7 /100 | #217 | Tragic $41,678 |
| Trinidadians and Tobagonians | 9.5 /100 | #218 | Tragic $41,655 |
| Puget Sound Salish | 8.1 /100 | #219 | Tragic $41,495 |
| Immigrants | Barbados | 7.9 /100 | #220 | Tragic $41,478 |
| Immigrants | Trinidad and Tobago | 7.9 /100 | #221 | Tragic $41,476 |
| Immigrants | Iraq | 7.1 /100 | #222 | Tragic $41,365 |
| Immigrants | Cameroon | 6.8 /100 | #223 | Tragic $41,334 |
| Immigrants | St. Vincent and the Grenadines | 6.4 /100 | #224 | Tragic $41,270 |