Immigrants from Congo vs Immigrants from Costa Rica Per Capita Income
COMPARE
Immigrants from Congo
Immigrants from Costa Rica
Per Capita Income
Per Capita Income Comparison
Immigrants from Congo
Immigrants from Costa Rica
$35,720
PER CAPITA INCOME
0.0/ 100
METRIC RATING
319th/ 347
METRIC RANK
$43,464
PER CAPITA INCOME
44.5/ 100
METRIC RATING
178th/ 347
METRIC RANK
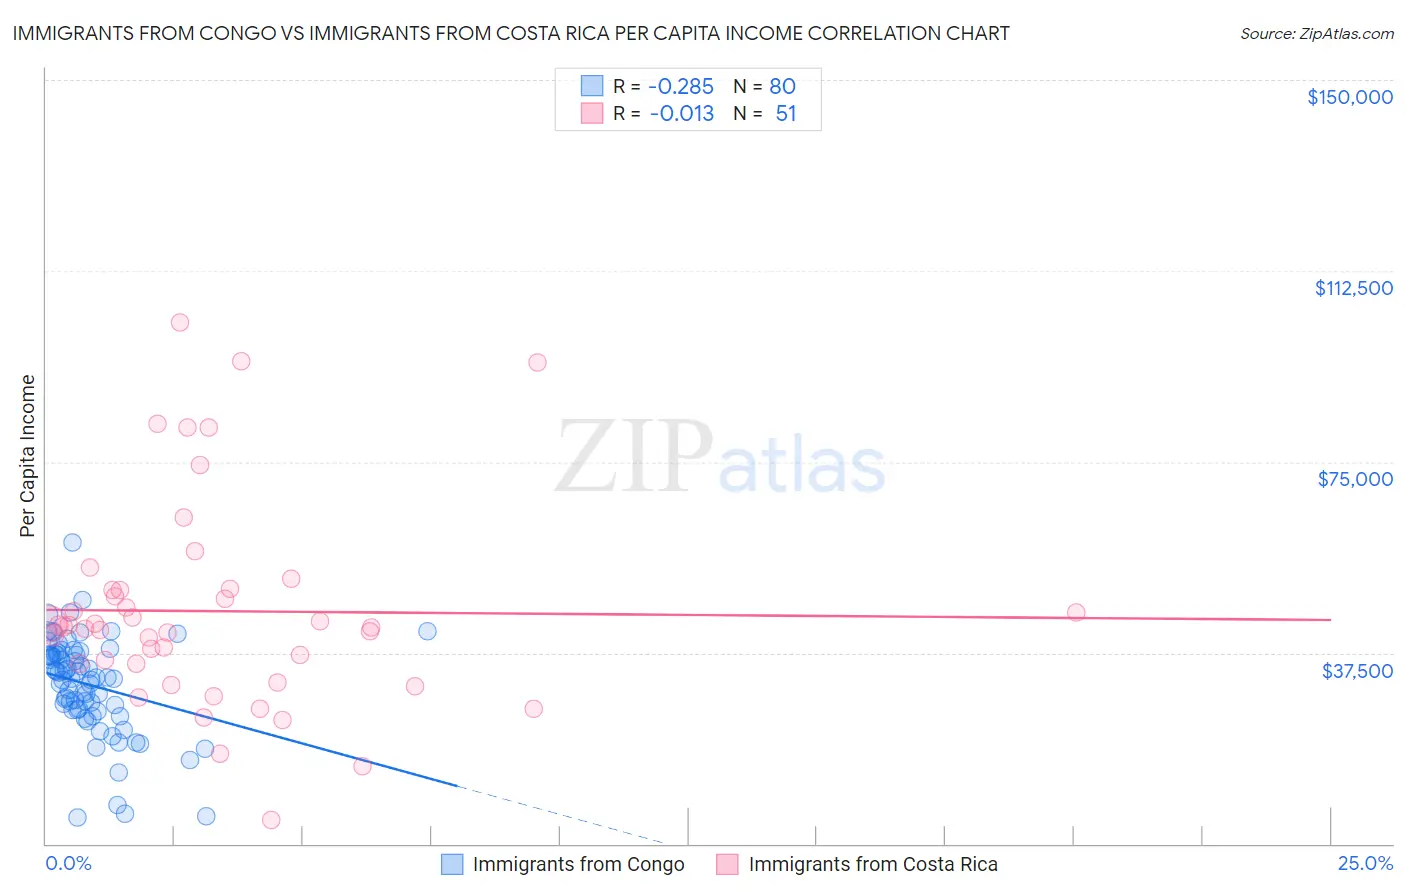
Immigrants from Congo vs Immigrants from Costa Rica Per Capita Income Correlation Chart
The statistical analysis conducted on geographies consisting of 92,126,617 people shows a weak negative correlation between the proportion of Immigrants from Congo and per capita income in the United States with a correlation coefficient (R) of -0.285 and weighted average of $35,720. Similarly, the statistical analysis conducted on geographies consisting of 204,277,265 people shows no correlation between the proportion of Immigrants from Costa Rica and per capita income in the United States with a correlation coefficient (R) of -0.013 and weighted average of $43,464, a difference of 21.7%.
Per Capita Income Correlation Summary
| Measurement | Immigrants from Congo | Immigrants from Costa Rica |
| Minimum | $5,075 | $4,614 |
| Maximum | $59,125 | $102,492 |
| Range | $54,050 | $97,878 |
| Mean | $31,172 | $45,686 |
| Median | $32,475 | $42,626 |
| Interquartile 25% (IQ1) | $26,293 | $35,269 |
| Interquartile 75% (IQ3) | $37,243 | $49,864 |
| Interquartile Range (IQR) | $10,950 | $14,595 |
| Standard Deviation (Sample) | $9,699 | $20,176 |
| Standard Deviation (Population) | $9,639 | $19,977 |
Similar Demographics by Per Capita Income
Demographics Similar to Immigrants from Congo by Per Capita Income
In terms of per capita income, the demographic groups most similar to Immigrants from Congo are Hispanic or Latino ($35,688, a difference of 0.090%), Black/African American ($35,564, a difference of 0.44%), Creek ($35,546, a difference of 0.49%), Bangladeshi ($35,897, a difference of 0.50%), and Dutch West Indian ($35,922, a difference of 0.57%).
| Demographics | Rating | Rank | Per Capita Income |
| Chickasaw | 0.0 /100 | #312 | Tragic $36,475 |
| Bahamians | 0.0 /100 | #313 | Tragic $36,427 |
| Seminole | 0.0 /100 | #314 | Tragic $36,180 |
| Yaqui | 0.0 /100 | #315 | Tragic $36,112 |
| Choctaw | 0.0 /100 | #316 | Tragic $35,999 |
| Dutch West Indians | 0.0 /100 | #317 | Tragic $35,922 |
| Bangladeshis | 0.0 /100 | #318 | Tragic $35,897 |
| Immigrants | Congo | 0.0 /100 | #319 | Tragic $35,720 |
| Hispanics or Latinos | 0.0 /100 | #320 | Tragic $35,688 |
| Blacks/African Americans | 0.0 /100 | #321 | Tragic $35,564 |
| Creek | 0.0 /100 | #322 | Tragic $35,546 |
| Cheyenne | 0.0 /100 | #323 | Tragic $35,276 |
| Kiowa | 0.0 /100 | #324 | Tragic $35,102 |
| Immigrants | Central America | 0.0 /100 | #325 | Tragic $34,974 |
| Immigrants | Cuba | 0.0 /100 | #326 | Tragic $34,910 |
Demographics Similar to Immigrants from Costa Rica by Per Capita Income
In terms of per capita income, the demographic groups most similar to Immigrants from Costa Rica are Finnish ($43,461, a difference of 0.010%), Tlingit-Haida ($43,516, a difference of 0.12%), Sierra Leonean ($43,405, a difference of 0.14%), Immigrants from South Eastern Asia ($43,539, a difference of 0.17%), and Celtic ($43,621, a difference of 0.36%).
| Demographics | Rating | Rank | Per Capita Income |
| Immigrants | Eastern Africa | 54.9 /100 | #171 | Average $43,838 |
| Czechoslovakians | 54.1 /100 | #172 | Average $43,806 |
| French | 50.7 /100 | #173 | Average $43,685 |
| Colombians | 50.0 /100 | #174 | Average $43,661 |
| Celtics | 48.9 /100 | #175 | Average $43,621 |
| Immigrants | South Eastern Asia | 46.6 /100 | #176 | Average $43,539 |
| Tlingit-Haida | 45.9 /100 | #177 | Average $43,516 |
| Immigrants | Costa Rica | 44.5 /100 | #178 | Average $43,464 |
| Finns | 44.4 /100 | #179 | Average $43,461 |
| Sierra Leoneans | 42.9 /100 | #180 | Average $43,405 |
| Welsh | 38.2 /100 | #181 | Fair $43,233 |
| Immigrants | Vietnam | 38.1 /100 | #182 | Fair $43,229 |
| Germans | 33.9 /100 | #183 | Fair $43,067 |
| Spaniards | 32.9 /100 | #184 | Fair $43,028 |
| Immigrants | Immigrants | 32.5 /100 | #185 | Fair $43,010 |