Immigrants from Uruguay vs Immigrants from Costa Rica Per Capita Income
COMPARE
Immigrants from Uruguay
Immigrants from Costa Rica
Per Capita Income
Per Capita Income Comparison
Immigrants from Uruguay
Immigrants from Costa Rica
$43,997
PER CAPITA INCOME
59.3/ 100
METRIC RATING
166th/ 347
METRIC RANK
$43,464
PER CAPITA INCOME
44.5/ 100
METRIC RATING
178th/ 347
METRIC RANK
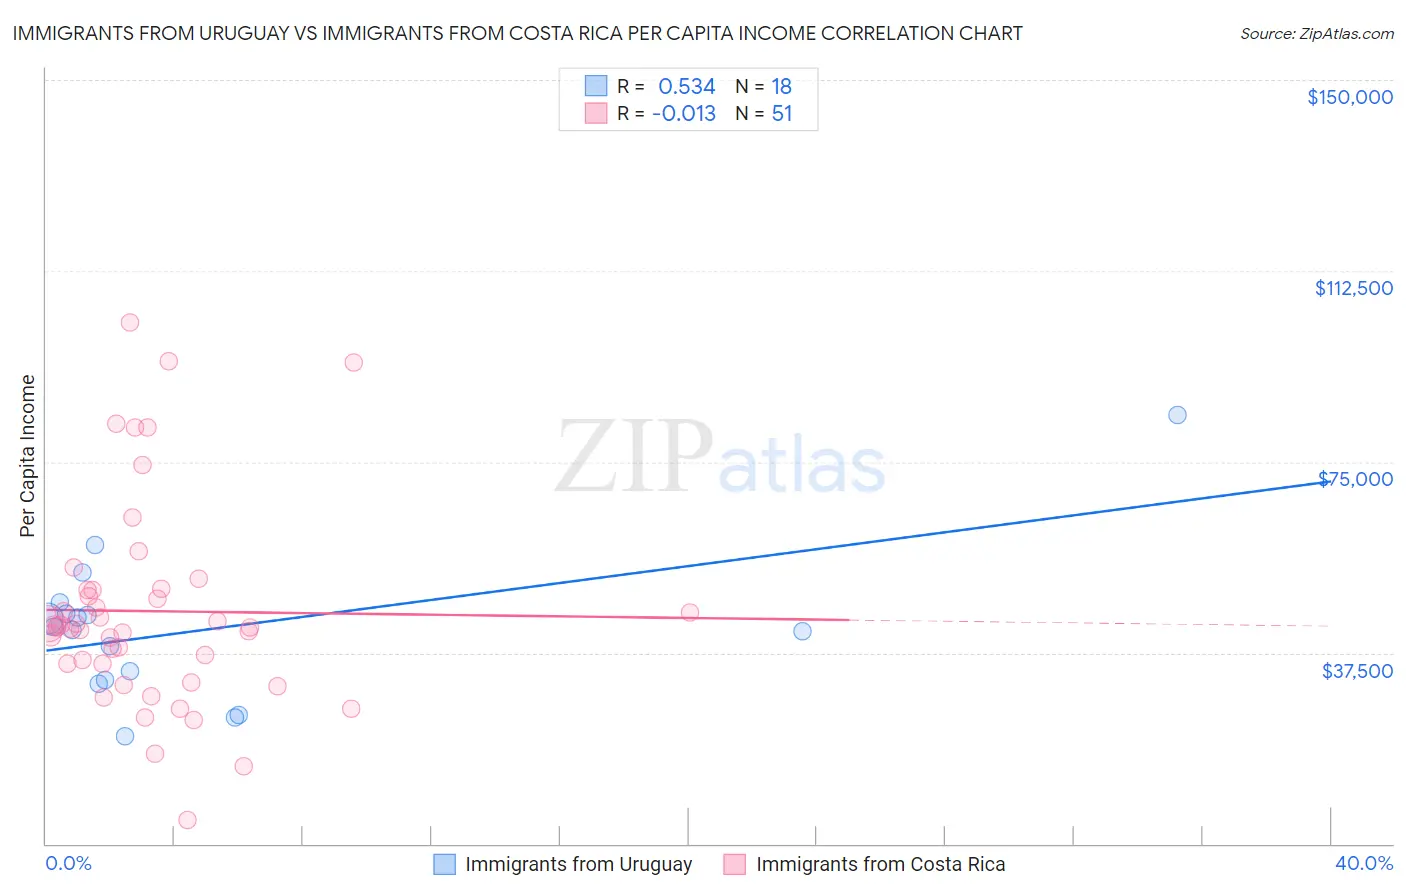
Immigrants from Uruguay vs Immigrants from Costa Rica Per Capita Income Correlation Chart
The statistical analysis conducted on geographies consisting of 133,259,667 people shows a substantial positive correlation between the proportion of Immigrants from Uruguay and per capita income in the United States with a correlation coefficient (R) of 0.534 and weighted average of $43,997. Similarly, the statistical analysis conducted on geographies consisting of 204,277,265 people shows no correlation between the proportion of Immigrants from Costa Rica and per capita income in the United States with a correlation coefficient (R) of -0.013 and weighted average of $43,464, a difference of 1.2%.
Per Capita Income Correlation Summary
| Measurement | Immigrants from Uruguay | Immigrants from Costa Rica |
| Minimum | $21,194 | $4,614 |
| Maximum | $84,313 | $102,492 |
| Range | $63,119 | $97,878 |
| Mean | $42,012 | $45,686 |
| Median | $42,230 | $42,626 |
| Interquartile 25% (IQ1) | $32,137 | $35,269 |
| Interquartile 75% (IQ3) | $45,280 | $49,864 |
| Interquartile Range (IQR) | $13,143 | $14,595 |
| Standard Deviation (Sample) | $14,447 | $20,176 |
| Standard Deviation (Population) | $14,040 | $19,977 |
Demographics Similar to Immigrants from Uruguay and Immigrants from Costa Rica by Per Capita Income
In terms of per capita income, the demographic groups most similar to Immigrants from Uruguay are Immigrants from Philippines ($44,000, a difference of 0.010%), English ($43,982, a difference of 0.030%), Sri Lankan ($44,014, a difference of 0.040%), Belgian ($43,951, a difference of 0.10%), and Immigrants from South America ($44,068, a difference of 0.16%). Similarly, the demographic groups most similar to Immigrants from Costa Rica are Finnish ($43,461, a difference of 0.010%), Tlingit-Haida ($43,516, a difference of 0.12%), Sierra Leonean ($43,405, a difference of 0.14%), Immigrants from South Eastern Asia ($43,539, a difference of 0.17%), and Celtic ($43,621, a difference of 0.36%).
| Demographics | Rating | Rank | Per Capita Income |
| Swiss | 61.4 /100 | #162 | Good $44,076 |
| Immigrants | South America | 61.2 /100 | #163 | Good $44,068 |
| Sri Lankans | 59.8 /100 | #164 | Average $44,014 |
| Immigrants | Philippines | 59.4 /100 | #165 | Average $44,000 |
| Immigrants | Uruguay | 59.3 /100 | #166 | Average $43,997 |
| English | 58.9 /100 | #167 | Average $43,982 |
| Belgians | 58.1 /100 | #168 | Average $43,951 |
| Immigrants | Peru | 55.3 /100 | #169 | Average $43,852 |
| Scandinavians | 55.2 /100 | #170 | Average $43,848 |
| Immigrants | Eastern Africa | 54.9 /100 | #171 | Average $43,838 |
| Czechoslovakians | 54.1 /100 | #172 | Average $43,806 |
| French | 50.7 /100 | #173 | Average $43,685 |
| Colombians | 50.0 /100 | #174 | Average $43,661 |
| Celtics | 48.9 /100 | #175 | Average $43,621 |
| Immigrants | South Eastern Asia | 46.6 /100 | #176 | Average $43,539 |
| Tlingit-Haida | 45.9 /100 | #177 | Average $43,516 |
| Immigrants | Costa Rica | 44.5 /100 | #178 | Average $43,464 |
| Finns | 44.4 /100 | #179 | Average $43,461 |
| Sierra Leoneans | 42.9 /100 | #180 | Average $43,405 |
| Welsh | 38.2 /100 | #181 | Fair $43,233 |
| Immigrants | Vietnam | 38.1 /100 | #182 | Fair $43,229 |