Tohono O'odham vs Scotch-Irish Per Capita Income
COMPARE
Tohono O'odham
Scotch-Irish
Per Capita Income
Per Capita Income Comparison
Tohono O'odham
Scotch-Irish
$30,256
PER CAPITA INCOME
0.0/ 100
METRIC RATING
345th/ 347
METRIC RANK
$42,563
PER CAPITA INCOME
22.6/ 100
METRIC RATING
197th/ 347
METRIC RANK
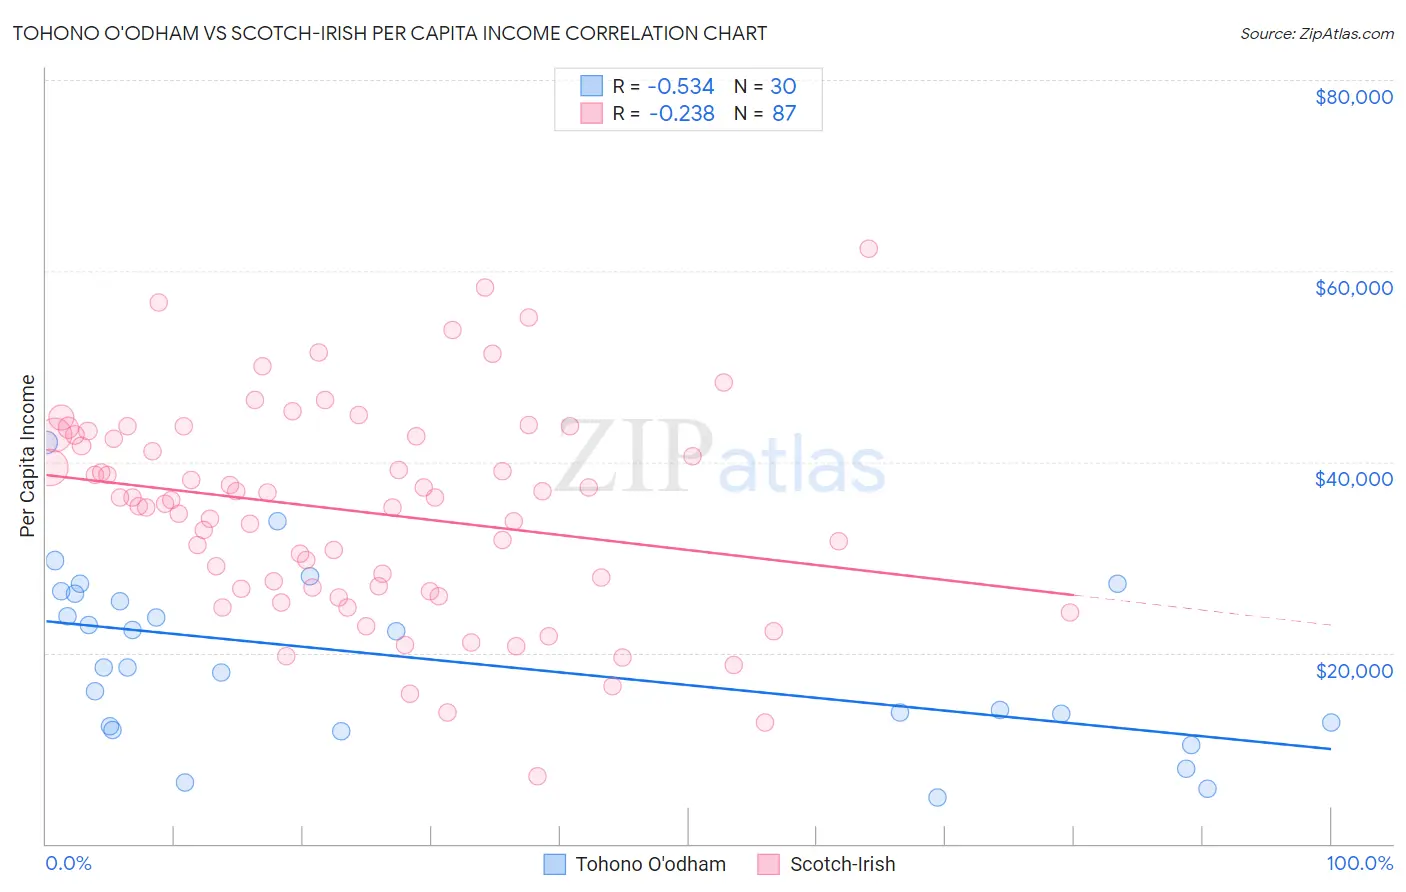
Tohono O'odham vs Scotch-Irish Per Capita Income Correlation Chart
The statistical analysis conducted on geographies consisting of 58,730,368 people shows a substantial negative correlation between the proportion of Tohono O'odham and per capita income in the United States with a correlation coefficient (R) of -0.534 and weighted average of $30,256. Similarly, the statistical analysis conducted on geographies consisting of 548,816,006 people shows a weak negative correlation between the proportion of Scotch-Irish and per capita income in the United States with a correlation coefficient (R) of -0.238 and weighted average of $42,563, a difference of 40.7%.
Per Capita Income Correlation Summary
| Measurement | Tohono O'odham | Scotch-Irish |
| Minimum | $4,874 | $7,124 |
| Maximum | $41,987 | $62,377 |
| Range | $37,113 | $55,253 |
| Mean | $19,246 | $34,830 |
| Median | $18,448 | $35,981 |
| Interquartile 25% (IQ1) | $12,324 | $26,689 |
| Interquartile 75% (IQ3) | $26,227 | $42,802 |
| Interquartile Range (IQR) | $13,903 | $16,113 |
| Standard Deviation (Sample) | $8,934 | $10,987 |
| Standard Deviation (Population) | $8,784 | $10,923 |
Similar Demographics by Per Capita Income
Demographics Similar to Tohono O'odham by Per Capita Income
In terms of per capita income, the demographic groups most similar to Tohono O'odham are Yup'ik ($30,518, a difference of 0.87%), Pima ($30,644, a difference of 1.3%), Lumbee ($29,845, a difference of 1.4%), Hopi ($31,177, a difference of 3.0%), and Puerto Rican ($31,268, a difference of 3.4%).
| Demographics | Rating | Rank | Per Capita Income |
| Immigrants | Yemen | 0.0 /100 | #333 | Tragic $33,696 |
| Natives/Alaskans | 0.0 /100 | #334 | Tragic $33,279 |
| Yuman | 0.0 /100 | #335 | Tragic $33,236 |
| Yakama | 0.0 /100 | #336 | Tragic $33,009 |
| Houma | 0.0 /100 | #337 | Tragic $32,996 |
| Arapaho | 0.0 /100 | #338 | Tragic $32,345 |
| Pueblo | 0.0 /100 | #339 | Tragic $32,012 |
| Crow | 0.0 /100 | #340 | Tragic $31,729 |
| Puerto Ricans | 0.0 /100 | #341 | Tragic $31,268 |
| Hopi | 0.0 /100 | #342 | Tragic $31,177 |
| Pima | 0.0 /100 | #343 | Tragic $30,644 |
| Yup'ik | 0.0 /100 | #344 | Tragic $30,518 |
| Tohono O'odham | 0.0 /100 | #345 | Tragic $30,256 |
| Lumbee | 0.0 /100 | #346 | Tragic $29,845 |
| Navajo | 0.0 /100 | #347 | Tragic $29,031 |
Demographics Similar to Scotch-Irish by Per Capita Income
In terms of per capita income, the demographic groups most similar to Scotch-Irish are Dutch ($42,605, a difference of 0.10%), Immigrants from Kenya ($42,661, a difference of 0.23%), Immigrants from Fiji ($42,694, a difference of 0.31%), Immigrants from Portugal ($42,412, a difference of 0.36%), and Barbadian ($42,406, a difference of 0.37%).
| Demographics | Rating | Rank | Per Capita Income |
| Kenyans | 27.7 /100 | #190 | Fair $42,808 |
| Yugoslavians | 27.4 /100 | #191 | Fair $42,792 |
| Iraqis | 26.7 /100 | #192 | Fair $42,760 |
| Immigrants | Sierra Leone | 26.5 /100 | #193 | Fair $42,752 |
| Immigrants | Fiji | 25.2 /100 | #194 | Fair $42,694 |
| Immigrants | Kenya | 24.5 /100 | #195 | Fair $42,661 |
| Dutch | 23.4 /100 | #196 | Fair $42,605 |
| Scotch-Irish | 22.6 /100 | #197 | Fair $42,563 |
| Immigrants | Portugal | 19.7 /100 | #198 | Poor $42,412 |
| Barbadians | 19.6 /100 | #199 | Poor $42,406 |
| Vietnamese | 19.0 /100 | #200 | Poor $42,368 |
| Immigrants | Thailand | 17.6 /100 | #201 | Poor $42,289 |
| Immigrants | Bosnia and Herzegovina | 17.5 /100 | #202 | Poor $42,278 |
| Spanish | 17.0 /100 | #203 | Poor $42,249 |
| Aleuts | 16.4 /100 | #204 | Poor $42,210 |