Moroccan vs Black/African American Householder Income Under 25 years
COMPARE
Moroccan
Black/African American
Householder Income Under 25 years
Householder Income Under 25 years Comparison
Moroccans
Blacks/African Americans
$53,256
HOUSEHOLDER INCOME UNDER 25 YEARS
93.1/ 100
METRIC RATING
132nd/ 347
METRIC RANK
$44,381
HOUSEHOLDER INCOME UNDER 25 YEARS
0.0/ 100
METRIC RATING
340th/ 347
METRIC RANK
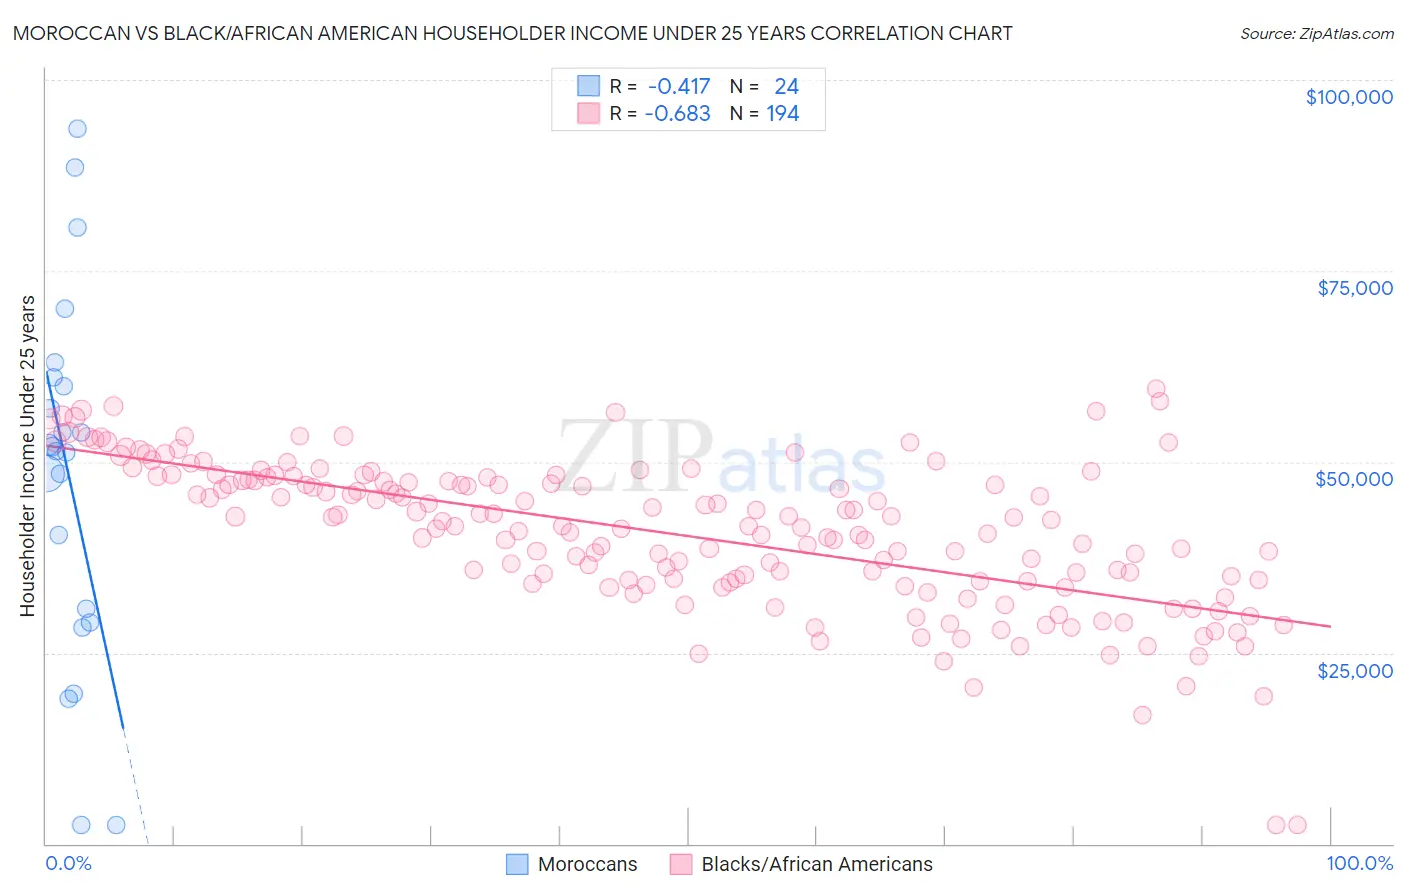
Moroccan vs Black/African American Householder Income Under 25 years Correlation Chart
The statistical analysis conducted on geographies consisting of 180,752,865 people shows a moderate negative correlation between the proportion of Moroccans and household income with householder under the age of 25 in the United States with a correlation coefficient (R) of -0.417 and weighted average of $53,256. Similarly, the statistical analysis conducted on geographies consisting of 438,583,318 people shows a significant negative correlation between the proportion of Blacks/African Americans and household income with householder under the age of 25 in the United States with a correlation coefficient (R) of -0.683 and weighted average of $44,381, a difference of 20.0%.
Householder Income Under 25 years Correlation Summary
| Measurement | Moroccan | Black/African American |
| Minimum | $2,499 | $2,499 |
| Maximum | $93,569 | $59,638 |
| Range | $91,070 | $57,139 |
| Mean | $48,217 | $40,625 |
| Median | $51,677 | $41,554 |
| Interquartile 25% (IQ1) | $29,861 | $34,429 |
| Interquartile 75% (IQ3) | $60,431 | $47,684 |
| Interquartile Range (IQR) | $30,570 | $13,255 |
| Standard Deviation (Sample) | $23,674 | $9,747 |
| Standard Deviation (Population) | $23,176 | $9,722 |
Similar Demographics by Householder Income Under 25 years
Demographics Similar to Moroccans by Householder Income Under 25 years
In terms of householder income under 25 years, the demographic groups most similar to Moroccans are Immigrants from Nicaragua ($53,266, a difference of 0.020%), Nicaraguan ($53,275, a difference of 0.030%), New Zealander ($53,294, a difference of 0.070%), Immigrants from Bulgaria ($53,305, a difference of 0.090%), and Immigrants from North America ($53,307, a difference of 0.10%).
| Demographics | Rating | Rank | Householder Income Under 25 years |
| Pakistanis | 94.1 /100 | #125 | Exceptional $53,325 |
| Immigrants | Serbia | 94.1 /100 | #126 | Exceptional $53,321 |
| Immigrants | North America | 93.9 /100 | #127 | Exceptional $53,307 |
| Immigrants | Bulgaria | 93.9 /100 | #128 | Exceptional $53,305 |
| New Zealanders | 93.7 /100 | #129 | Exceptional $53,294 |
| Nicaraguans | 93.4 /100 | #130 | Exceptional $53,275 |
| Immigrants | Nicaragua | 93.3 /100 | #131 | Exceptional $53,266 |
| Moroccans | 93.1 /100 | #132 | Exceptional $53,256 |
| Immigrants | Immigrants | 92.2 /100 | #133 | Exceptional $53,201 |
| Immigrants | Northern Africa | 91.9 /100 | #134 | Exceptional $53,185 |
| Chileans | 91.9 /100 | #135 | Exceptional $53,185 |
| Armenians | 91.8 /100 | #136 | Exceptional $53,179 |
| Immigrants | Barbados | 91.5 /100 | #137 | Exceptional $53,163 |
| Norwegians | 90.8 /100 | #138 | Exceptional $53,127 |
| Costa Ricans | 90.4 /100 | #139 | Exceptional $53,106 |
Demographics Similar to Blacks/African Americans by Householder Income Under 25 years
In terms of householder income under 25 years, the demographic groups most similar to Blacks/African Americans are Houma ($44,356, a difference of 0.060%), Kiowa ($44,733, a difference of 0.79%), Chickasaw ($44,763, a difference of 0.86%), Arapaho ($44,003, a difference of 0.86%), and Pueblo ($45,018, a difference of 1.4%).
| Demographics | Rating | Rank | Householder Income Under 25 years |
| Creek | 0.0 /100 | #333 | Tragic $45,371 |
| Cajuns | 0.0 /100 | #334 | Tragic $45,338 |
| Cheyenne | 0.0 /100 | #335 | Tragic $45,275 |
| Tohono O'odham | 0.0 /100 | #336 | Tragic $45,248 |
| Pueblo | 0.0 /100 | #337 | Tragic $45,018 |
| Chickasaw | 0.0 /100 | #338 | Tragic $44,763 |
| Kiowa | 0.0 /100 | #339 | Tragic $44,733 |
| Blacks/African Americans | 0.0 /100 | #340 | Tragic $44,381 |
| Houma | 0.0 /100 | #341 | Tragic $44,356 |
| Arapaho | 0.0 /100 | #342 | Tragic $44,003 |
| Immigrants | Yemen | 0.0 /100 | #343 | Tragic $43,591 |
| Immigrants | Congo | 0.0 /100 | #344 | Tragic $43,266 |
| Navajo | 0.0 /100 | #345 | Tragic $42,380 |
| Puerto Ricans | 0.0 /100 | #346 | Tragic $39,726 |
| Lumbee | 0.0 /100 | #347 | Tragic $34,584 |