Russian vs Immigrants from Sweden Per Capita Income

COMPARE

Russian
Race
Ancestry
AfghanAfricanAlaska NativeAlaskan AthabascanAlbanianAleutAlsatianAmericanApacheArabArapahoArgentineanArmenianAssyrian/Chaldean/SyriacAustralianAustrianBahamianBangladeshiBarbadianBasqueBelgianBelizeanBermudanBhutaneseBlackfeetBolivianBrazilianBritishBritish West IndianBulgarianBurmeseCajunCambodianCanadianCape VerdeanCarpatho RusynCelticCentral AmericanCentral American IndianCherokeeCheyenneChickasawChileanChineseChippewaChoctawColombianColvilleComancheCosta RicanCreeCreekCroatianCrowCubanCypriotCzechCzechoslovakianDanishDelawareDominicanDutchDutch West IndianEastern EuropeanEcuadorianEgyptianEnglishEstonianEthiopianEuropeanFijianFilipinoFinnishFrenchFrench American IndianFrench CanadianGermanGerman RussianGhanaianGreekGuamanian/ChamorroGuatemalanGuyaneseHaitianHmongHonduranHopiHoumaHungarianIcelanderIndian (Asian)IndonesianInupiatIranianIraqiIrishIroquoisIsraeliItalianJamaicanJapaneseJordanianKenyanKiowaKoreanLaotianLatvianLebaneseLiberianLithuanianLumbeeLuxembourgerMacedonianMalaysianMalteseMarshalleseMenomineeMexicanMexican American IndianMongolianMoroccanNative HawaiianNavajoNepaleseNew ZealanderNicaraguanNigerianNorthern EuropeanNorwegianOkinawanOsageOttawaPaiutePakistaniPalestinianPanamanianParaguayanPennsylvania GermanPeruvianPimaPolishPortuguesePotawatomiPuebloPuerto RicanPuget Sound SalishRomanianRussianSalvadoranSamoanScandinavianScotch-IrishScottishSeminoleSenegaleseSerbianShoshoneSierra LeoneanSiouxSlavicSlovakSloveneSomaliSouth AfricanSouth AmericanSouth American IndianSoviet UnionSpaniardSpanishSpanish AmericanSpanish American IndianSri LankanSubsaharan AfricanSudaneseSwedishSwissSyrianTaiwaneseThaiTlingit-HaidaTohono O'OdhamTonganTrinidadian and TobagonianTsimshianTurkishU.S. Virgin IslanderUgandanUkrainianUruguayanUteVenezuelanVietnameseWelshWest IndianYakamaYaquiYugoslavianYumanYup'ikZimbabwean
Immigration
NonimmigrantsImmigrantsAfghanistanAfricaAlbaniaArgentinaArmeniaAsiaAustraliaAustriaBahamasBangladeshBarbadosBelarusBelgiumBelizeBoliviaBosnia and HerzegovinaBrazilBulgariaBurma/MyanmarCabo VerdeCambodiaCameroonCanadaCaribbeanCentral AmericaChileChinaColombiaCongoCosta RicaCroatiaCubaCzechoslovakiaDenmarkDominicaDominican RepublicEastern AfricaEastern AsiaEastern EuropeEcuadorEgyptEl SalvadorEnglandEritreaEthiopiaEuropeFijiFranceGermanyGhanaGreeceGrenadaGuatemalaGuyanaHaitiHondurasHong KongHungaryIndiaIndonesiaIranIraqIrelandIsraelItalyJamaicaJapanJordanKazakhstanKenyaKoreaKuwaitLaosLatin AmericaLatviaLebanonLiberiaLithuaniaMalaysiaMexicoMicronesiaMiddle AfricaMoldovaMoroccoNepalNetherlandsNicaraguaNigeriaNorth AmericaNorth MacedoniaNorthern AfricaNorthern EuropeNorwayOceaniaPakistanPanamaPeruPhilippinesPolandPortugalRomaniaRussiaSaudi ArabiaScotlandSenegalSerbiaSierra LeoneSingaporeSomaliaSouth AfricaSouth AmericaSouth Central AsiaSouth Eastern AsiaSouthern EuropeSpainSri LankaSt. Vincent and the GrenadinesSudanSwitzerlandSyriaTaiwanThailandTrinidad and TobagoTurkeyUgandaUkraineUruguayUzbekistanVenezuelaVietnamWest IndiesWestern AfricaWestern AsiaWestern EuropeYemenZaireZimbabweAzores
Immigrants from Sweden
Race
Ancestry
AfghanAfricanAlaska NativeAlaskan AthabascanAlbanianAleutAlsatianAmericanApacheArabArapahoArgentineanArmenianAssyrian/Chaldean/SyriacAustralianAustrianBahamianBangladeshiBarbadianBasqueBelgianBelizeanBermudanBhutaneseBlackfeetBolivianBrazilianBritishBritish West IndianBulgarianBurmeseCajunCambodianCanadianCape VerdeanCarpatho RusynCelticCentral AmericanCentral American IndianCherokeeCheyenneChickasawChileanChineseChippewaChoctawColombianColvilleComancheCosta RicanCreeCreekCroatianCrowCubanCypriotCzechCzechoslovakianDanishDelawareDominicanDutchDutch West IndianEastern EuropeanEcuadorianEgyptianEnglishEstonianEthiopianEuropeanFijianFilipinoFinnishFrenchFrench American IndianFrench CanadianGermanGerman RussianGhanaianGreekGuamanian/ChamorroGuatemalanGuyaneseHaitianHmongHonduranHopiHoumaHungarianIcelanderIndian (Asian)IndonesianInupiatIranianIraqiIrishIroquoisIsraeliItalianJamaicanJapaneseJordanianKenyanKiowaKoreanLaotianLatvianLebaneseLiberianLithuanianLumbeeLuxembourgerMacedonianMalaysianMalteseMarshalleseMenomineeMexicanMexican American IndianMongolianMoroccanNative HawaiianNavajoNepaleseNew ZealanderNicaraguanNigerianNorthern EuropeanNorwegianOkinawanOsageOttawaPaiutePakistaniPalestinianPanamanianParaguayanPennsylvania GermanPeruvianPimaPolishPortuguesePotawatomiPuebloPuerto RicanPuget Sound SalishRomanianSalvadoranSamoanScandinavianScotch-IrishScottishSeminoleSenegaleseSerbianShoshoneSierra LeoneanSiouxSlavicSlovakSloveneSomaliSouth AfricanSouth AmericanSouth American IndianSoviet UnionSpaniardSpanishSpanish AmericanSpanish American IndianSri LankanSubsaharan AfricanSudaneseSwedishSwissSyrianTaiwaneseThaiTlingit-HaidaTohono O'OdhamTonganTrinidadian and TobagonianTsimshianTurkishU.S. Virgin IslanderUgandanUkrainianUruguayanUteVenezuelanVietnameseWelshWest IndianYakamaYaquiYugoslavianYumanYup'ikZimbabwean
Immigration
NonimmigrantsImmigrantsAfghanistanAfricaAlbaniaArgentinaArmeniaAsiaAustraliaAustriaBahamasBangladeshBarbadosBelarusBelgiumBelizeBoliviaBosnia and HerzegovinaBrazilBulgariaBurma/MyanmarCabo VerdeCambodiaCameroonCanadaCaribbeanCentral AmericaChileChinaColombiaCongoCosta RicaCroatiaCubaCzechoslovakiaDenmarkDominicaDominican RepublicEastern AfricaEastern AsiaEastern EuropeEcuadorEgyptEl SalvadorEnglandEritreaEthiopiaEuropeFijiFranceGermanyGhanaGreeceGrenadaGuatemalaGuyanaHaitiHondurasHong KongHungaryIndiaIndonesiaIranIraqIrelandIsraelItalyJamaicaJapanJordanKazakhstanKenyaKoreaKuwaitLaosLatin AmericaLatviaLebanonLiberiaLithuaniaMalaysiaMexicoMicronesiaMiddle AfricaMoldovaMoroccoNepalNetherlandsNicaraguaNigeriaNorth AmericaNorth MacedoniaNorthern AfricaNorthern EuropeNorwayOceaniaPakistanPanamaPeruPhilippinesPolandPortugalRomaniaRussiaSaudi ArabiaScotlandSenegalSerbiaSierra LeoneSingaporeSomaliaSouth AfricaSouth AmericaSouth Central AsiaSouth Eastern AsiaSouthern EuropeSpainSri LankaSt. Vincent and the GrenadinesSudanSwedenSwitzerlandSyriaTaiwanThailandTrinidad and TobagoTurkeyUgandaUkraineUruguayUzbekistanVenezuelaVietnamWest IndiesWestern AfricaWestern AsiaWestern EuropeYemenZaireZimbabweAzores
Per Capita Income
Income
Poverty
Unemployment
Labor Participation
Family Structure
Vehicle Availability
Education Level
Disability

Per Capita Income Comparison

Russians

Immigrants from Sweden

Exceptional
Exceptional
$53,154
PER CAPITA INCOME
100.0/ 100
METRIC RATING
26th/ 347
METRIC RANK
$55,582
PER CAPITA INCOME
100.0/ 100
METRIC RATING
12th/ 347
METRIC RANK

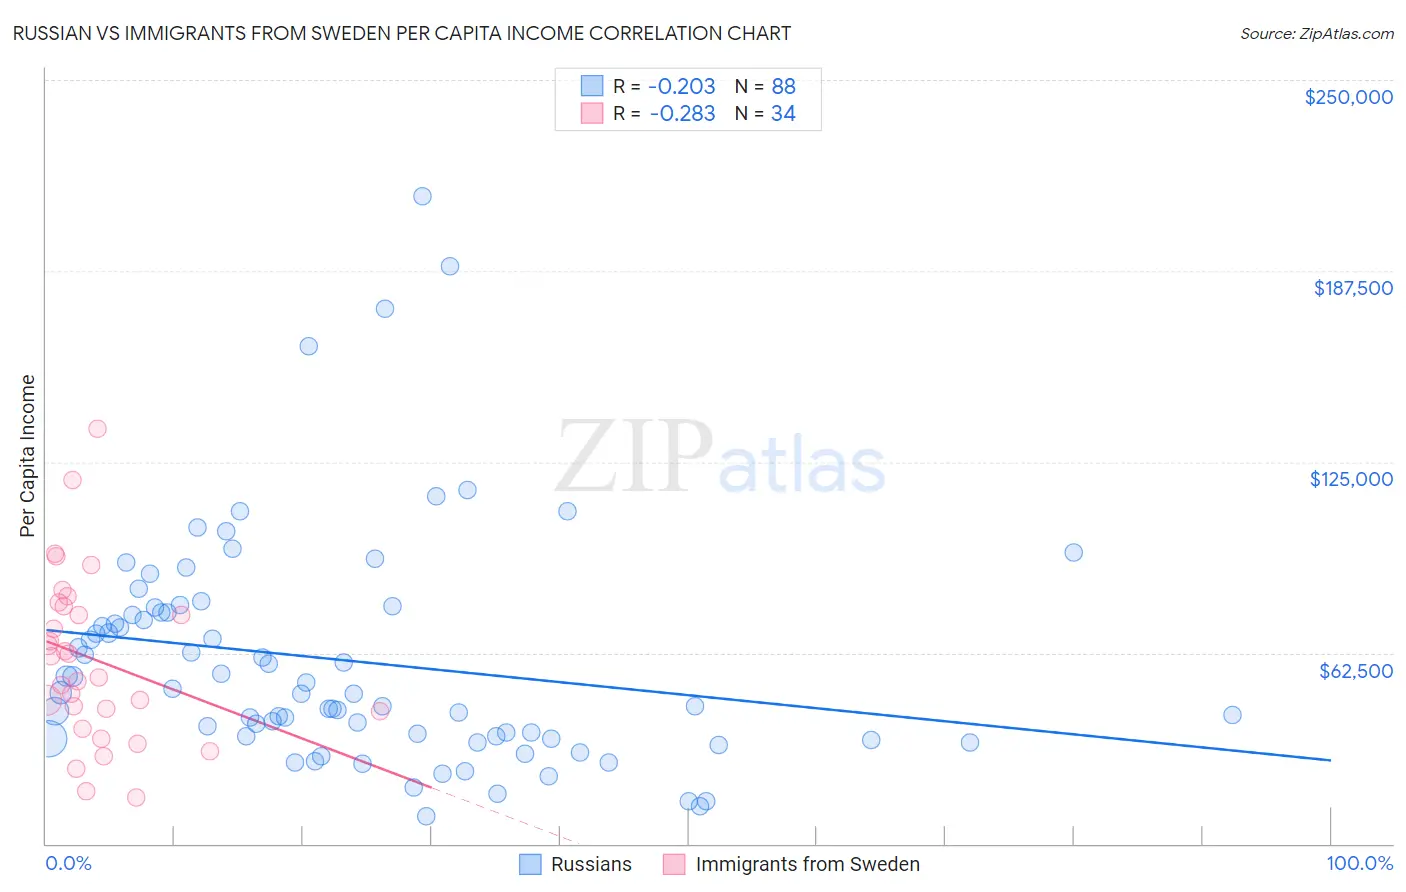
Russian vs Immigrants from Sweden Per Capita Income Correlation Chart

The statistical analysis conducted on geographies consisting of 512,304,099 people shows a weak negative correlation between the proportion of Russians and per capita income in the United States with a correlation coefficient (R) of -0.203 and weighted average of $53,154. Similarly, the statistical analysis conducted on geographies consisting of 164,749,853 people shows a weak negative correlation between the proportion of Immigrants from Sweden and per capita income in the United States with a correlation coefficient (R) of -0.283 and weighted average of $55,582, a difference of 4.6%.
Russian vs Immigrants from Sweden Per Capita Income

Per Capita Income Correlation Summary

MeasurementRussianImmigrants from Sweden
Minimum$9,193$15,015
Maximum$212,036$135,828
Range$202,843$120,813
Mean$59,937$60,294
Median$49,383$57,777
Interquartile 25% (IQ1)$34,688$43,188
Interquartile 75% (IQ3)$75,613$77,916
Interquartile Range (IQR)$40,926$34,728
Standard Deviation (Sample)$37,845$27,626
Standard Deviation (Population)$37,630$27,217

Demographics Similar to Russians and Immigrants from Sweden by Per Capita Income

In terms of per capita income, the demographic groups most similar to Russians are Immigrants from Japan ($53,359, a difference of 0.39%), Immigrants from South Central Asia ($52,660, a difference of 0.94%), Latvian ($52,649, a difference of 0.96%), Israeli ($52,596, a difference of 1.1%), and Immigrants from Denmark ($53,799, a difference of 1.2%). Similarly, the demographic groups most similar to Immigrants from Sweden are Eastern European ($55,780, a difference of 0.36%), Okinawan ($55,817, a difference of 0.42%), Immigrants from India ($55,268, a difference of 0.57%), Immigrants from Belgium ($55,082, a difference of 0.91%), and Cypriot ($54,899, a difference of 1.2%).
DemographicsRating | RankPer Capita Income
Immigrants | Ireland
100.0
/100
|
#9
Exceptional
$56,584
Okinawans
100.0
/100
|
#10
Exceptional
$55,817
Eastern Europeans
100.0
/100
|
#11
Exceptional
$55,780
Immigrants | Sweden
100.0
/100
|
#12
Exceptional
$55,582
Immigrants | India
100.0
/100
|
#13
Exceptional
$55,268
Immigrants | Belgium
100.0
/100
|
#14
Exceptional
$55,082
Cypriots
100.0
/100
|
#15
Exceptional
$54,899
Immigrants | Switzerland
100.0
/100
|
#16
Exceptional
$54,866
Immigrants | France
100.0
/100
|
#17
Exceptional
$54,557
Thais
100.0
/100
|
#18
Exceptional
$54,307
Immigrants | China
100.0
/100
|
#19
Exceptional
$54,264
Soviet Union
100.0
/100
|
#20
Exceptional
$54,202
Immigrants | Northern Europe
100.0
/100
|
#21
Exceptional
$54,159
Indians (Asian)
100.0
/100
|
#22
Exceptional
$53,874
Immigrants | Eastern Asia
100.0
/100
|
#23
Exceptional
$53,806
Immigrants | Denmark
100.0
/100
|
#24
Exceptional
$53,799
Immigrants | Japan
100.0
/100
|
#25
Exceptional
$53,359
Russians
100.0
/100
|
#26
Exceptional
$53,154
Immigrants | South Central Asia
100.0
/100
|
#27
Exceptional
$52,660
Latvians
100.0
/100
|
#28
Exceptional
$52,649
Israelis
100.0
/100
|
#29
Exceptional
$52,596