Tlingit-Haida vs Guamanian/Chamorro Unemployment Among Ages 60 to 64 years
COMPARE
Tlingit-Haida
Guamanian/Chamorro
Unemployment Among Ages 60 to 64 years
Unemployment Among Ages 60 to 64 years Comparison
Tlingit-Haida
Guamanians/Chamorros
6.4%
UNEMPLOYMENT AMONG AGES 60 TO 64 YEARS
0.0/ 100
METRIC RATING
339th/ 347
METRIC RANK
4.9%
UNEMPLOYMENT AMONG AGES 60 TO 64 YEARS
23.7/ 100
METRIC RATING
198th/ 347
METRIC RANK
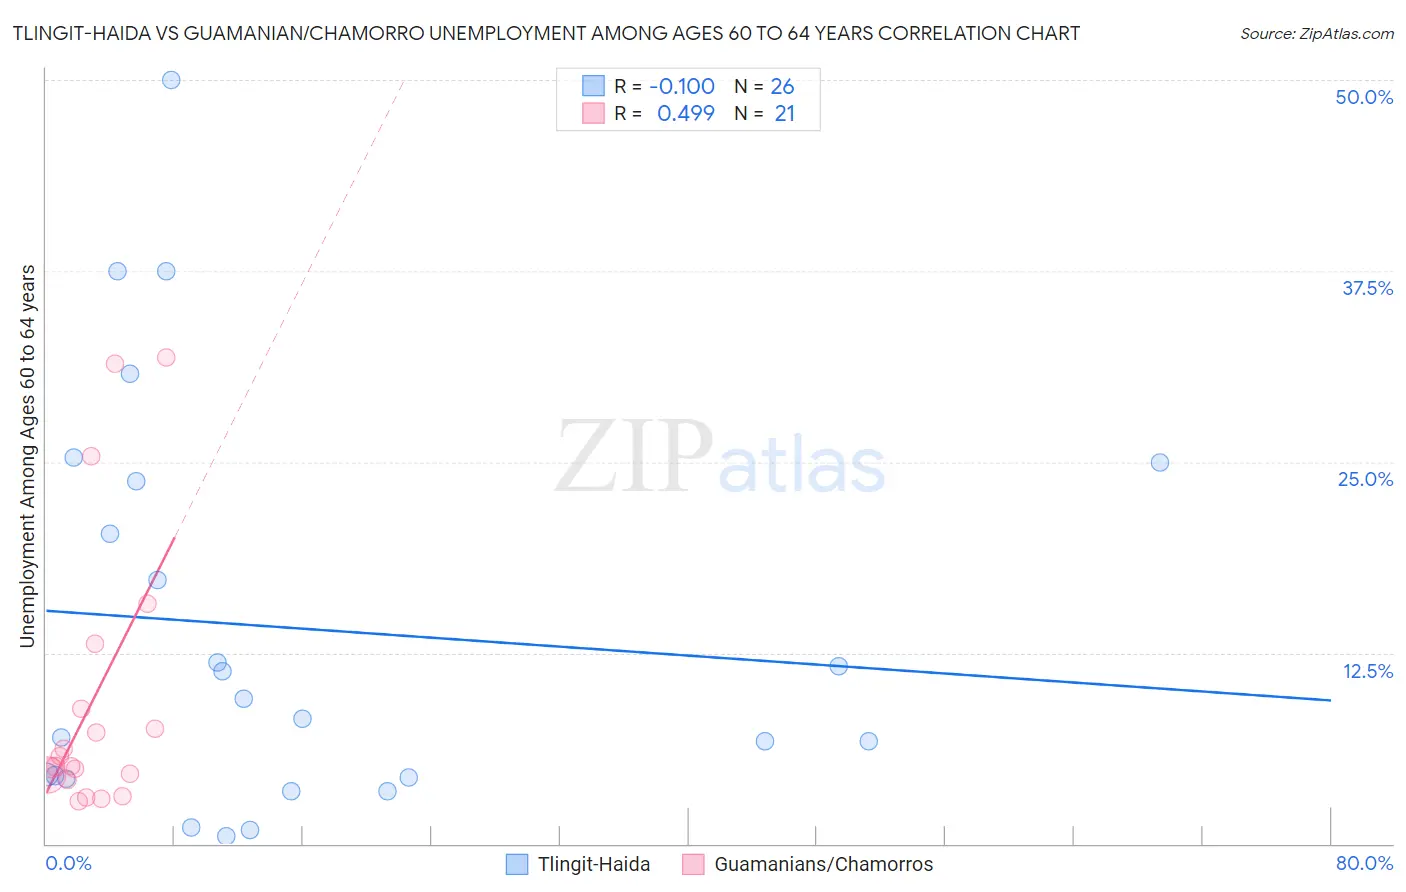
Tlingit-Haida vs Guamanian/Chamorro Unemployment Among Ages 60 to 64 years Correlation Chart
The statistical analysis conducted on geographies consisting of 58,290,195 people shows a slight negative correlation between the proportion of Tlingit-Haida and unemployment rate among population between the ages 60 and 64 in the United States with a correlation coefficient (R) of -0.100 and weighted average of 6.4%. Similarly, the statistical analysis conducted on geographies consisting of 209,235,205 people shows a moderate positive correlation between the proportion of Guamanians/Chamorros and unemployment rate among population between the ages 60 and 64 in the United States with a correlation coefficient (R) of 0.499 and weighted average of 4.9%, a difference of 30.1%.
Unemployment Among Ages 60 to 64 years Correlation Summary
| Measurement | Tlingit-Haida | Guamanian/Chamorro |
| Minimum | 0.50% | 2.8% |
| Maximum | 50.0% | 31.8% |
| Range | 49.5% | 29.0% |
| Mean | 14.1% | 9.4% |
| Median | 8.8% | 5.1% |
| Interquartile 25% (IQ1) | 4.3% | 4.3% |
| Interquartile 75% (IQ3) | 23.7% | 11.0% |
| Interquartile Range (IQR) | 19.4% | 6.6% |
| Standard Deviation (Sample) | 13.3% | 9.1% |
| Standard Deviation (Population) | 13.0% | 8.8% |
Similar Demographics by Unemployment Among Ages 60 to 64 years
Demographics Similar to Tlingit-Haida by Unemployment Among Ages 60 to 64 years
In terms of unemployment among ages 60 to 64 years, the demographic groups most similar to Tlingit-Haida are Arapaho (6.3%, a difference of 1.4%), Navajo (6.3%, a difference of 1.9%), Kiowa (6.2%, a difference of 3.0%), Vietnamese (6.1%, a difference of 5.0%), and Puerto Rican (6.1%, a difference of 5.2%).
| Demographics | Rating | Rank | Unemployment Among Ages 60 to 64 years |
| Dominicans | 0.0 /100 | #332 | Tragic 6.0% |
| Immigrants | Dominican Republic | 0.0 /100 | #333 | Tragic 6.0% |
| Puerto Ricans | 0.0 /100 | #334 | Tragic 6.1% |
| Vietnamese | 0.0 /100 | #335 | Tragic 6.1% |
| Kiowa | 0.0 /100 | #336 | Tragic 6.2% |
| Navajo | 0.0 /100 | #337 | Tragic 6.3% |
| Arapaho | 0.0 /100 | #338 | Tragic 6.3% |
| Tlingit-Haida | 0.0 /100 | #339 | Tragic 6.4% |
| Pueblo | 0.0 /100 | #340 | Tragic 6.7% |
| Yuman | 0.0 /100 | #341 | Tragic 6.8% |
| Aleuts | 0.0 /100 | #342 | Tragic 6.8% |
| Immigrants | Yemen | 0.0 /100 | #343 | Tragic 6.8% |
| Alaska Natives | 0.0 /100 | #344 | Tragic 7.6% |
| Alaskan Athabascans | 0.0 /100 | #345 | Tragic 8.4% |
| Inupiat | 0.0 /100 | #346 | Tragic 9.6% |
Demographics Similar to Guamanians/Chamorros by Unemployment Among Ages 60 to 64 years
In terms of unemployment among ages 60 to 64 years, the demographic groups most similar to Guamanians/Chamorros are Immigrants from Vietnam (4.9%, a difference of 0.0%), Immigrants from Czechoslovakia (4.9%, a difference of 0.010%), Colombian (4.9%, a difference of 0.050%), Immigrants from Eastern Europe (4.9%, a difference of 0.070%), and Immigrants from Asia (4.9%, a difference of 0.090%).
| Demographics | Rating | Rank | Unemployment Among Ages 60 to 64 years |
| Immigrants | Nigeria | 29.6 /100 | #191 | Fair 4.9% |
| Menominee | 28.8 /100 | #192 | Fair 4.9% |
| Houma | 28.3 /100 | #193 | Fair 4.9% |
| Immigrants | Colombia | 26.8 /100 | #194 | Fair 4.9% |
| Immigrants | Austria | 26.6 /100 | #195 | Fair 4.9% |
| Immigrants | Asia | 25.7 /100 | #196 | Fair 4.9% |
| Immigrants | Eastern Europe | 25.2 /100 | #197 | Fair 4.9% |
| Guamanians/Chamorros | 23.7 /100 | #198 | Fair 4.9% |
| Immigrants | Vietnam | 23.7 /100 | #199 | Fair 4.9% |
| Immigrants | Czechoslovakia | 23.5 /100 | #200 | Fair 4.9% |
| Colombians | 22.7 /100 | #201 | Fair 4.9% |
| Immigrants | Western Africa | 20.6 /100 | #202 | Fair 4.9% |
| Uruguayans | 19.9 /100 | #203 | Poor 4.9% |
| Russians | 18.9 /100 | #204 | Poor 4.9% |
| Immigrants | Indonesia | 17.4 /100 | #205 | Poor 4.9% |