Spanish vs Guamanian/Chamorro Median Family Income
COMPARE
Spanish
Guamanian/Chamorro
Median Family Income
Median Family Income Comparison
Spanish
Guamanians/Chamorros
$99,977
MEDIAN FAMILY INCOME
20.1/ 100
METRIC RATING
200th/ 347
METRIC RANK
$101,061
MEDIAN FAMILY INCOME
30.5/ 100
METRIC RATING
188th/ 347
METRIC RANK
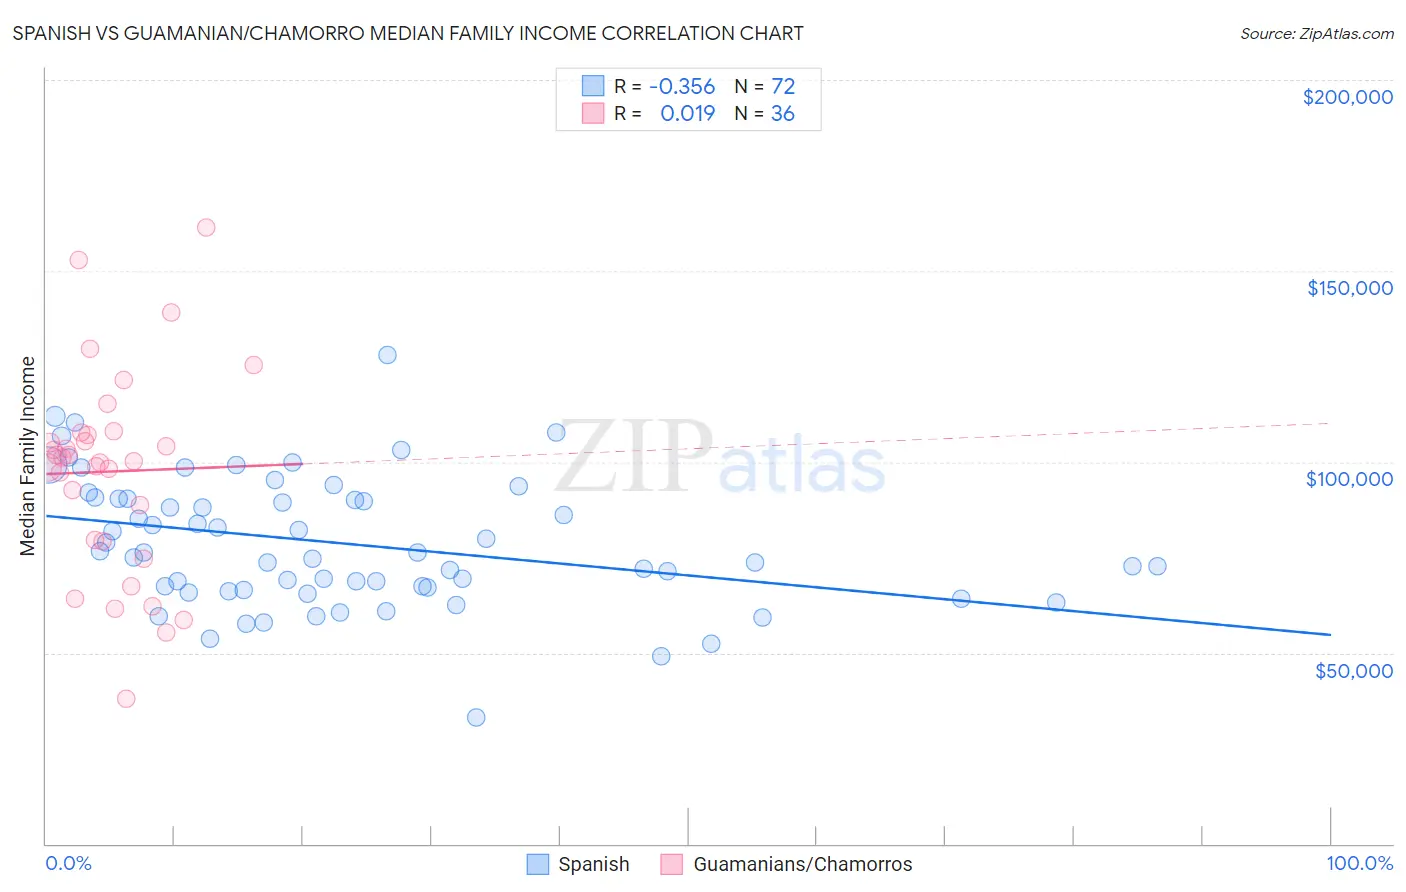
Spanish vs Guamanian/Chamorro Median Family Income Correlation Chart
The statistical analysis conducted on geographies consisting of 421,758,667 people shows a mild negative correlation between the proportion of Spanish and median family income in the United States with a correlation coefficient (R) of -0.356 and weighted average of $99,977. Similarly, the statistical analysis conducted on geographies consisting of 221,859,912 people shows no correlation between the proportion of Guamanians/Chamorros and median family income in the United States with a correlation coefficient (R) of 0.019 and weighted average of $101,061, a difference of 1.1%.
Median Family Income Correlation Summary
| Measurement | Spanish | Guamanian/Chamorro |
| Minimum | $32,992 | $37,991 |
| Maximum | $127,945 | $161,250 |
| Range | $94,953 | $123,259 |
| Mean | $78,597 | $97,460 |
| Median | $75,704 | $100,672 |
| Interquartile 25% (IQ1) | $66,829 | $79,398 |
| Interquartile 75% (IQ3) | $90,296 | $107,355 |
| Interquartile Range (IQR) | $23,466 | $27,957 |
| Standard Deviation (Sample) | $17,174 | $26,595 |
| Standard Deviation (Population) | $17,054 | $26,223 |
Demographics Similar to Spanish and Guamanians/Chamorros by Median Family Income
In terms of median family income, the demographic groups most similar to Spanish are Yugoslavian ($100,119, a difference of 0.14%), Immigrants from Thailand ($99,840, a difference of 0.14%), White/Caucasian ($99,800, a difference of 0.18%), Immigrants from Africa ($100,256, a difference of 0.28%), and Immigrants from Cameroon ($100,289, a difference of 0.31%). Similarly, the demographic groups most similar to Guamanians/Chamorros are Tlingit-Haida ($101,092, a difference of 0.030%), Celtic ($101,139, a difference of 0.080%), Immigrants from Portugal ($100,984, a difference of 0.080%), Immigrants ($100,962, a difference of 0.10%), and Dutch ($101,192, a difference of 0.13%).
| Demographics | Rating | Rank | Median Family Income |
| Immigrants | Costa Rica | 33.7 /100 | #184 | Fair $101,354 |
| Dutch | 31.9 /100 | #185 | Fair $101,192 |
| Celtics | 31.3 /100 | #186 | Fair $101,139 |
| Tlingit-Haida | 30.8 /100 | #187 | Fair $101,092 |
| Guamanians/Chamorros | 30.5 /100 | #188 | Fair $101,061 |
| Immigrants | Portugal | 29.6 /100 | #189 | Fair $100,984 |
| Immigrants | Immigrants | 29.4 /100 | #190 | Fair $100,962 |
| Colombians | 27.2 /100 | #191 | Fair $100,750 |
| Immigrants | Kenya | 26.5 /100 | #192 | Fair $100,679 |
| Iraqis | 26.3 /100 | #193 | Fair $100,658 |
| Uruguayans | 26.3 /100 | #194 | Fair $100,656 |
| Immigrants | South America | 23.9 /100 | #195 | Fair $100,414 |
| Samoans | 23.3 /100 | #196 | Fair $100,344 |
| Immigrants | Cameroon | 22.8 /100 | #197 | Fair $100,289 |
| Immigrants | Africa | 22.5 /100 | #198 | Fair $100,256 |
| Yugoslavians | 21.3 /100 | #199 | Fair $100,119 |
| Spanish | 20.1 /100 | #200 | Fair $99,977 |
| Immigrants | Thailand | 19.0 /100 | #201 | Poor $99,840 |
| Whites/Caucasians | 18.7 /100 | #202 | Poor $99,800 |
| Scotch-Irish | 17.1 /100 | #203 | Poor $99,591 |
| Ghanaians | 12.6 /100 | #204 | Poor $98,877 |