Immigrants from Romania vs Guamanian/Chamorro Median Family Income
COMPARE
Immigrants from Romania
Guamanian/Chamorro
Median Family Income
Median Family Income Comparison
Immigrants from Romania
Guamanians/Chamorros
$113,434
MEDIAN FAMILY INCOME
99.6/ 100
METRIC RATING
70th/ 347
METRIC RANK
$101,061
MEDIAN FAMILY INCOME
30.5/ 100
METRIC RATING
188th/ 347
METRIC RANK
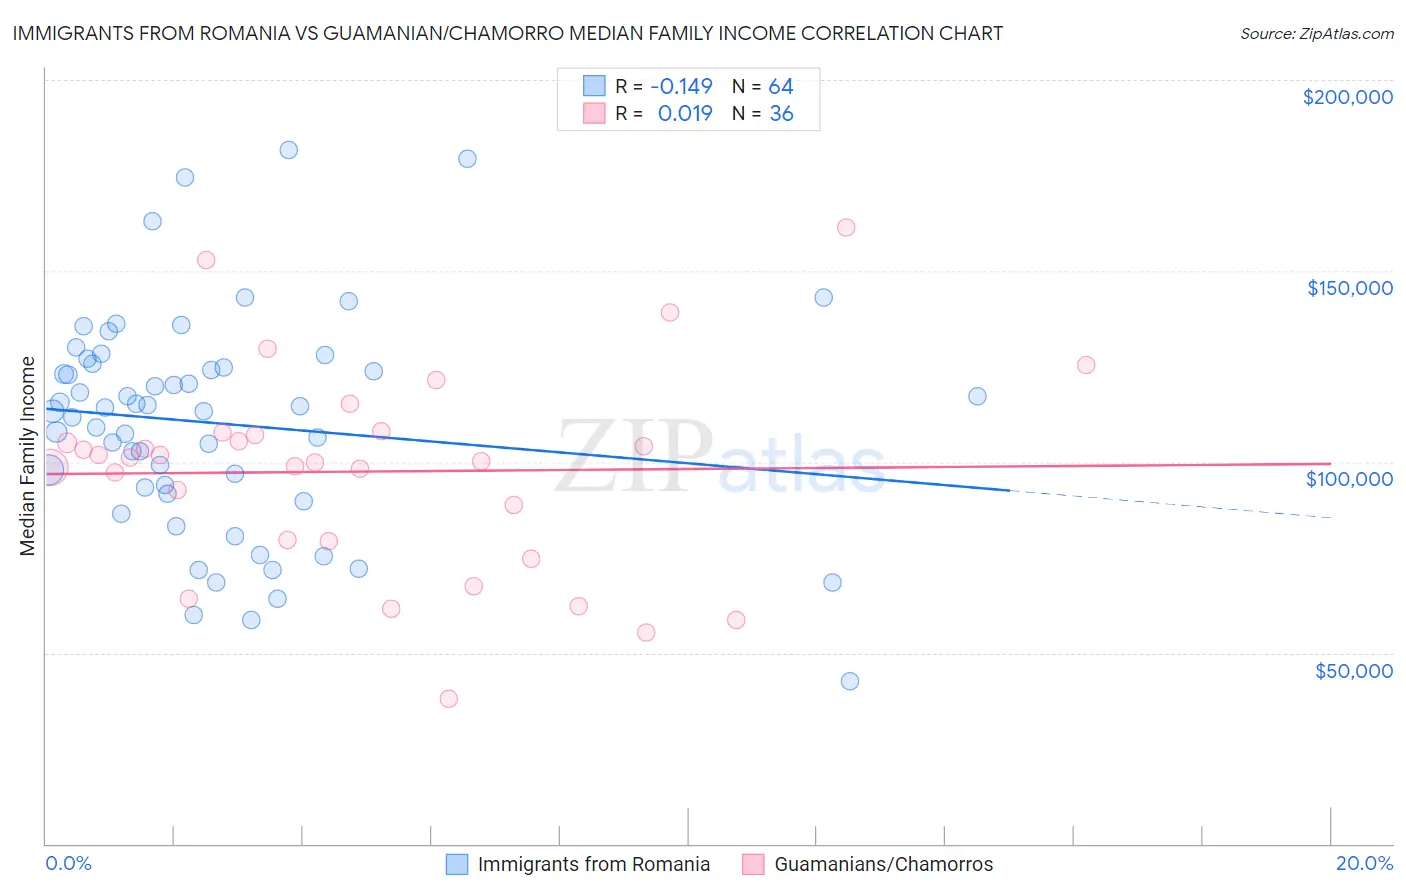
Immigrants from Romania vs Guamanian/Chamorro Median Family Income Correlation Chart
The statistical analysis conducted on geographies consisting of 256,919,145 people shows a poor negative correlation between the proportion of Immigrants from Romania and median family income in the United States with a correlation coefficient (R) of -0.149 and weighted average of $113,434. Similarly, the statistical analysis conducted on geographies consisting of 221,859,912 people shows no correlation between the proportion of Guamanians/Chamorros and median family income in the United States with a correlation coefficient (R) of 0.019 and weighted average of $101,061, a difference of 12.2%.
Median Family Income Correlation Summary
| Measurement | Immigrants from Romania | Guamanian/Chamorro |
| Minimum | $42,500 | $37,991 |
| Maximum | $181,711 | $161,250 |
| Range | $139,211 | $123,259 |
| Mean | $109,959 | $97,460 |
| Median | $113,781 | $100,672 |
| Interquartile 25% (IQ1) | $92,391 | $79,398 |
| Interquartile 75% (IQ3) | $125,210 | $107,355 |
| Interquartile Range (IQR) | $32,820 | $27,957 |
| Standard Deviation (Sample) | $28,709 | $26,595 |
| Standard Deviation (Population) | $28,484 | $26,223 |
Similar Demographics by Median Family Income
Demographics Similar to Immigrants from Romania by Median Family Income
In terms of median family income, the demographic groups most similar to Immigrants from Romania are Immigrants from Bulgaria ($113,461, a difference of 0.020%), Immigrants from Serbia ($113,463, a difference of 0.030%), South African ($113,229, a difference of 0.18%), Immigrants from Spain ($113,815, a difference of 0.34%), and Afghan ($112,971, a difference of 0.41%).
| Demographics | Rating | Rank | Median Family Income |
| Immigrants | Pakistan | 99.8 /100 | #63 | Exceptional $114,406 |
| Immigrants | Scotland | 99.7 /100 | #64 | Exceptional $114,392 |
| Egyptians | 99.7 /100 | #65 | Exceptional $114,119 |
| Paraguayans | 99.7 /100 | #66 | Exceptional $114,016 |
| Immigrants | Spain | 99.7 /100 | #67 | Exceptional $113,815 |
| Immigrants | Serbia | 99.6 /100 | #68 | Exceptional $113,463 |
| Immigrants | Bulgaria | 99.6 /100 | #69 | Exceptional $113,461 |
| Immigrants | Romania | 99.6 /100 | #70 | Exceptional $113,434 |
| South Africans | 99.5 /100 | #71 | Exceptional $113,229 |
| Afghans | 99.5 /100 | #72 | Exceptional $112,971 |
| Laotians | 99.5 /100 | #73 | Exceptional $112,859 |
| Immigrants | Italy | 99.4 /100 | #74 | Exceptional $112,848 |
| Immigrants | Western Europe | 99.4 /100 | #75 | Exceptional $112,688 |
| Argentineans | 99.4 /100 | #76 | Exceptional $112,665 |
| Immigrants | Eastern Europe | 99.4 /100 | #77 | Exceptional $112,527 |
Demographics Similar to Guamanians/Chamorros by Median Family Income
In terms of median family income, the demographic groups most similar to Guamanians/Chamorros are Tlingit-Haida ($101,092, a difference of 0.030%), Celtic ($101,139, a difference of 0.080%), Immigrants from Portugal ($100,984, a difference of 0.080%), Immigrants ($100,962, a difference of 0.10%), and Dutch ($101,192, a difference of 0.13%).
| Demographics | Rating | Rank | Median Family Income |
| Spaniards | 36.8 /100 | #181 | Fair $101,617 |
| Tsimshian | 35.9 /100 | #182 | Fair $101,543 |
| Kenyans | 34.5 /100 | #183 | Fair $101,417 |
| Immigrants | Costa Rica | 33.7 /100 | #184 | Fair $101,354 |
| Dutch | 31.9 /100 | #185 | Fair $101,192 |
| Celtics | 31.3 /100 | #186 | Fair $101,139 |
| Tlingit-Haida | 30.8 /100 | #187 | Fair $101,092 |
| Guamanians/Chamorros | 30.5 /100 | #188 | Fair $101,061 |
| Immigrants | Portugal | 29.6 /100 | #189 | Fair $100,984 |
| Immigrants | Immigrants | 29.4 /100 | #190 | Fair $100,962 |
| Colombians | 27.2 /100 | #191 | Fair $100,750 |
| Immigrants | Kenya | 26.5 /100 | #192 | Fair $100,679 |
| Iraqis | 26.3 /100 | #193 | Fair $100,658 |
| Uruguayans | 26.3 /100 | #194 | Fair $100,656 |
| Immigrants | South America | 23.9 /100 | #195 | Fair $100,414 |