Hawaiian vs British West Indian Per Capita Income
COMPARE
Hawaiian
British West Indian
Per Capita Income
Per Capita Income Comparison
Hawaiians
British West Indians
$39,403
PER CAPITA INCOME
0.8/ 100
METRIC RATING
256th/ 347
METRIC RANK
$40,330
PER CAPITA INCOME
2.3/ 100
METRIC RATING
241st/ 347
METRIC RANK
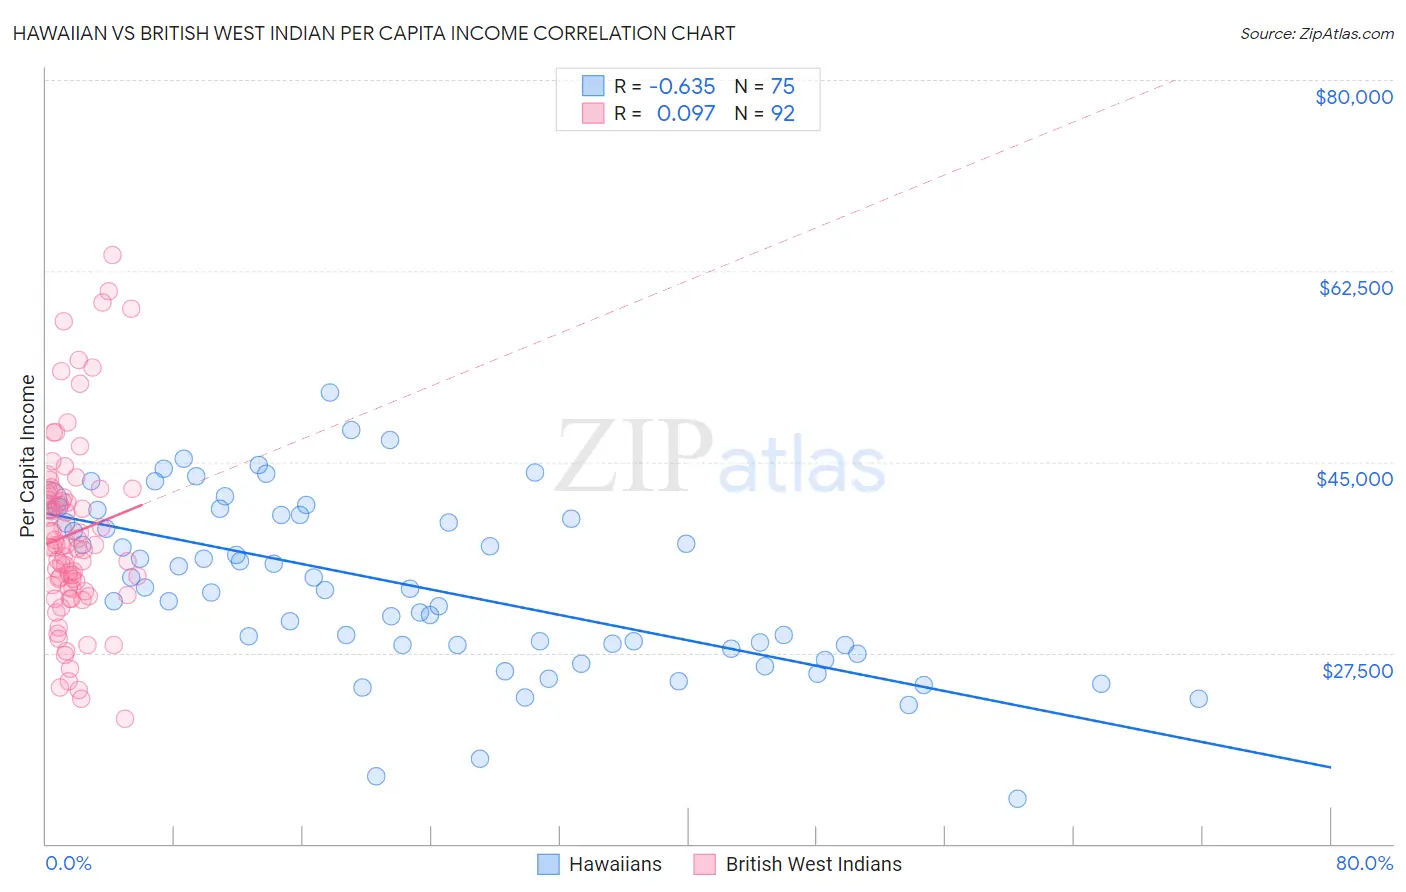
Hawaiian vs British West Indian Per Capita Income Correlation Chart
The statistical analysis conducted on geographies consisting of 327,629,067 people shows a significant negative correlation between the proportion of Hawaiians and per capita income in the United States with a correlation coefficient (R) of -0.635 and weighted average of $39,403. Similarly, the statistical analysis conducted on geographies consisting of 152,702,927 people shows a slight positive correlation between the proportion of British West Indians and per capita income in the United States with a correlation coefficient (R) of 0.097 and weighted average of $40,330, a difference of 2.4%.
Per Capita Income Correlation Summary
| Measurement | Hawaiian | British West Indian |
| Minimum | $14,082 | $21,502 |
| Maximum | $51,335 | $63,988 |
| Range | $37,253 | $42,486 |
| Mean | $33,620 | $38,416 |
| Median | $33,340 | $37,296 |
| Interquartile 25% (IQ1) | $28,161 | $33,460 |
| Interquartile 75% (IQ3) | $40,110 | $42,145 |
| Interquartile Range (IQR) | $11,949 | $8,686 |
| Standard Deviation (Sample) | $7,838 | $8,471 |
| Standard Deviation (Population) | $7,785 | $8,425 |
Demographics Similar to Hawaiians and British West Indians by Per Capita Income
In terms of per capita income, the demographic groups most similar to Hawaiians are Nicaraguan ($39,372, a difference of 0.080%), Immigrants from Middle Africa ($39,529, a difference of 0.32%), Alaska Native ($39,558, a difference of 0.39%), Osage ($39,568, a difference of 0.42%), and Jamaican ($39,231, a difference of 0.44%). Similarly, the demographic groups most similar to British West Indians are Immigrants from Nigeria ($40,339, a difference of 0.020%), Tsimshian ($40,344, a difference of 0.040%), Somali ($40,367, a difference of 0.090%), Immigrants from Western Africa ($40,294, a difference of 0.090%), and German Russian ($40,266, a difference of 0.16%).
| Demographics | Rating | Rank | Per Capita Income |
| Somalis | 2.4 /100 | #238 | Tragic $40,367 |
| Tsimshian | 2.4 /100 | #239 | Tragic $40,344 |
| Immigrants | Nigeria | 2.3 /100 | #240 | Tragic $40,339 |
| British West Indians | 2.3 /100 | #241 | Tragic $40,330 |
| Immigrants | Western Africa | 2.2 /100 | #242 | Tragic $40,294 |
| German Russians | 2.2 /100 | #243 | Tragic $40,266 |
| French American Indians | 2.1 /100 | #244 | Tragic $40,244 |
| Sub-Saharan Africans | 1.9 /100 | #245 | Tragic $40,152 |
| Cree | 1.7 /100 | #246 | Tragic $40,056 |
| Immigrants | Somalia | 1.6 /100 | #247 | Tragic $39,974 |
| Cape Verdeans | 1.5 /100 | #248 | Tragic $39,935 |
| Japanese | 1.4 /100 | #249 | Tragic $39,870 |
| Immigrants | Burma/Myanmar | 1.3 /100 | #250 | Tragic $39,827 |
| Samoans | 1.3 /100 | #251 | Tragic $39,826 |
| Immigrants | Azores | 1.0 /100 | #252 | Tragic $39,608 |
| Osage | 1.0 /100 | #253 | Tragic $39,568 |
| Alaska Natives | 1.0 /100 | #254 | Tragic $39,558 |
| Immigrants | Middle Africa | 1.0 /100 | #255 | Tragic $39,529 |
| Hawaiians | 0.8 /100 | #256 | Tragic $39,403 |
| Nicaraguans | 0.8 /100 | #257 | Tragic $39,372 |
| Jamaicans | 0.7 /100 | #258 | Tragic $39,231 |