Taiwanese vs Immigrants from Ukraine Householder Income Ages 45 - 64 years
COMPARE
Taiwanese
Immigrants from Ukraine
Householder Income Ages 45 - 64 years
Householder Income Ages 45 - 64 years Comparison
Taiwanese
Immigrants from Ukraine
$104,180
HOUSEHOLDER INCOME AGES 45 - 64 YEARS
87.4/ 100
METRIC RATING
136th/ 347
METRIC RANK
$107,079
HOUSEHOLDER INCOME AGES 45 - 64 YEARS
96.7/ 100
METRIC RATING
104th/ 347
METRIC RANK
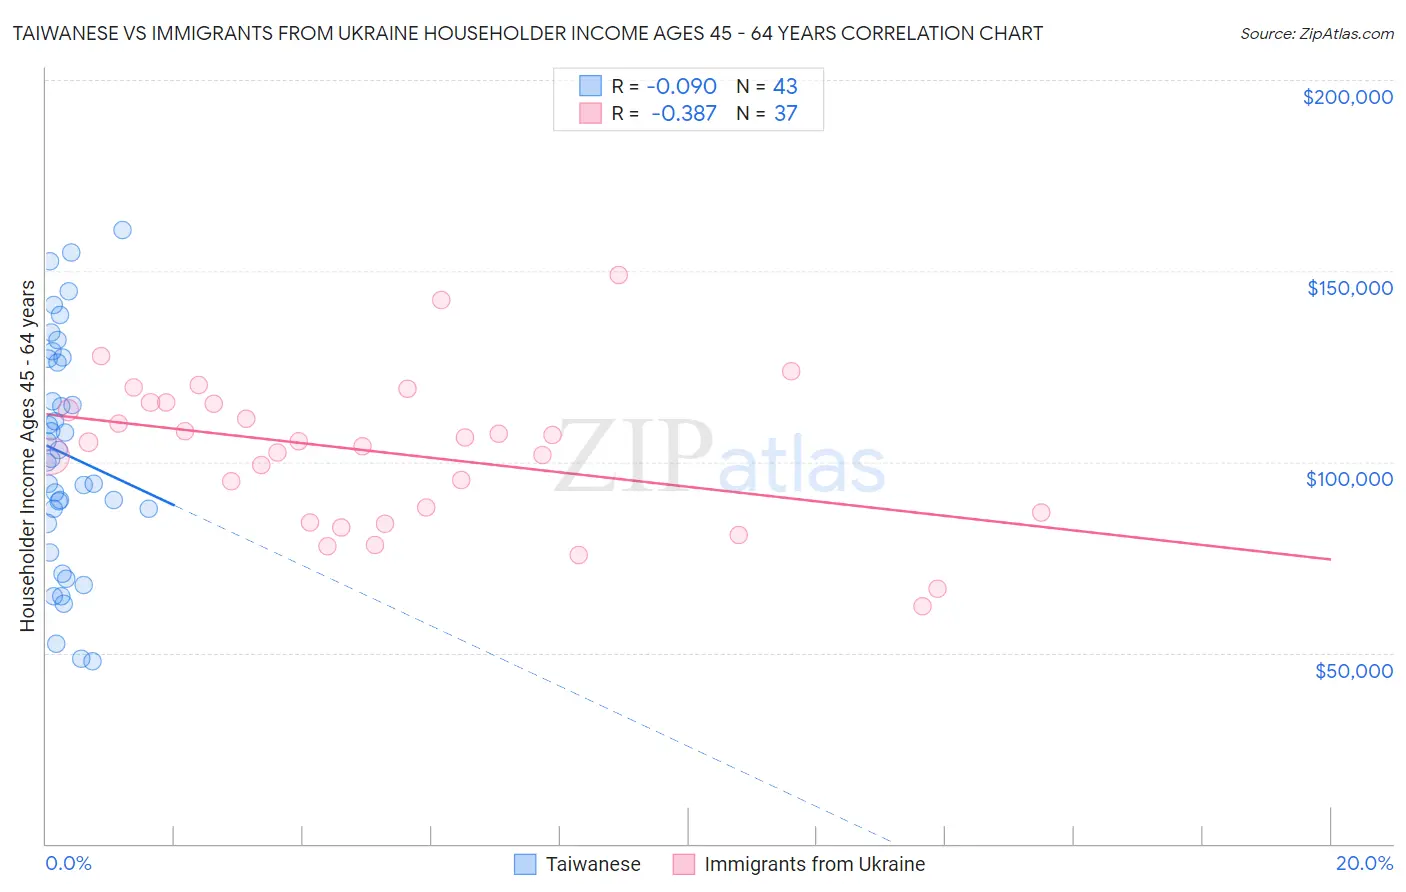
Taiwanese vs Immigrants from Ukraine Householder Income Ages 45 - 64 years Correlation Chart
The statistical analysis conducted on geographies consisting of 31,709,295 people shows a slight negative correlation between the proportion of Taiwanese and household income with householder between the ages 45 and 64 in the United States with a correlation coefficient (R) of -0.090 and weighted average of $104,180. Similarly, the statistical analysis conducted on geographies consisting of 289,443,409 people shows a mild negative correlation between the proportion of Immigrants from Ukraine and household income with householder between the ages 45 and 64 in the United States with a correlation coefficient (R) of -0.387 and weighted average of $107,079, a difference of 2.8%.
Householder Income Ages 45 - 64 years Correlation Summary
| Measurement | Taiwanese | Immigrants from Ukraine |
| Minimum | $47,813 | $62,178 |
| Maximum | $160,833 | $148,942 |
| Range | $113,020 | $86,764 |
| Mean | $102,027 | $102,397 |
| Median | $100,891 | $105,174 |
| Interquartile 25% (IQ1) | $83,846 | $85,429 |
| Interquartile 75% (IQ3) | $126,896 | $115,436 |
| Interquartile Range (IQR) | $43,050 | $30,007 |
| Standard Deviation (Sample) | $29,530 | $19,369 |
| Standard Deviation (Population) | $29,184 | $19,105 |
Similar Demographics by Householder Income Ages 45 - 64 years
Demographics Similar to Taiwanese by Householder Income Ages 45 - 64 years
In terms of householder income ages 45 - 64 years, the demographic groups most similar to Taiwanese are Brazilian ($104,408, a difference of 0.22%), Hungarian ($103,913, a difference of 0.26%), Canadian ($104,560, a difference of 0.36%), Arab ($104,566, a difference of 0.37%), and Ethiopian ($103,736, a difference of 0.43%).
| Demographics | Rating | Rank | Householder Income Ages 45 - 64 years |
| Peruvians | 91.5 /100 | #129 | Exceptional $105,070 |
| Immigrants | Zimbabwe | 91.2 /100 | #130 | Exceptional $104,992 |
| Immigrants | Syria | 90.7 /100 | #131 | Exceptional $104,858 |
| Lebanese | 90.1 /100 | #132 | Exceptional $104,734 |
| Arabs | 89.3 /100 | #133 | Excellent $104,566 |
| Canadians | 89.3 /100 | #134 | Excellent $104,560 |
| Brazilians | 88.6 /100 | #135 | Excellent $104,408 |
| Taiwanese | 87.4 /100 | #136 | Excellent $104,180 |
| Hungarians | 85.8 /100 | #137 | Excellent $103,913 |
| Ethiopians | 84.7 /100 | #138 | Excellent $103,736 |
| Immigrants | Oceania | 84.5 /100 | #139 | Excellent $103,705 |
| Norwegians | 84.3 /100 | #140 | Excellent $103,682 |
| Immigrants | Uganda | 83.7 /100 | #141 | Excellent $103,584 |
| Luxembourgers | 83.3 /100 | #142 | Excellent $103,536 |
| Serbians | 83.2 /100 | #143 | Excellent $103,522 |
Demographics Similar to Immigrants from Ukraine by Householder Income Ages 45 - 64 years
In terms of householder income ages 45 - 64 years, the demographic groups most similar to Immigrants from Ukraine are Macedonian ($107,074, a difference of 0.0%), Armenian ($107,002, a difference of 0.070%), Syrian ($107,207, a difference of 0.12%), Immigrants from Fiji ($106,952, a difference of 0.12%), and Zimbabwean ($106,849, a difference of 0.22%).
| Demographics | Rating | Rank | Householder Income Ages 45 - 64 years |
| Northern Europeans | 97.8 /100 | #97 | Exceptional $107,870 |
| Immigrants | Southern Europe | 97.7 /100 | #98 | Exceptional $107,775 |
| Palestinians | 97.6 /100 | #99 | Exceptional $107,721 |
| Immigrants | Serbia | 97.4 /100 | #100 | Exceptional $107,569 |
| Immigrants | Kazakhstan | 97.2 /100 | #101 | Exceptional $107,378 |
| Immigrants | Moldova | 97.1 /100 | #102 | Exceptional $107,357 |
| Syrians | 96.9 /100 | #103 | Exceptional $107,207 |
| Immigrants | Ukraine | 96.7 /100 | #104 | Exceptional $107,079 |
| Macedonians | 96.7 /100 | #105 | Exceptional $107,074 |
| Armenians | 96.6 /100 | #106 | Exceptional $107,002 |
| Immigrants | Fiji | 96.5 /100 | #107 | Exceptional $106,952 |
| Zimbabweans | 96.3 /100 | #108 | Exceptional $106,849 |
| Chileans | 95.9 /100 | #109 | Exceptional $106,611 |
| Immigrants | Brazil | 95.6 /100 | #110 | Exceptional $106,470 |
| Immigrants | Vietnam | 95.5 /100 | #111 | Exceptional $106,417 |