Taiwanese vs Slovak Householder Income Ages 45 - 64 years
COMPARE
Taiwanese
Slovak
Householder Income Ages 45 - 64 years
Householder Income Ages 45 - 64 years Comparison
Taiwanese
Slovaks
$104,180
HOUSEHOLDER INCOME AGES 45 - 64 YEARS
87.4/ 100
METRIC RATING
136th/ 347
METRIC RANK
$101,029
HOUSEHOLDER INCOME AGES 45 - 64 YEARS
58.8/ 100
METRIC RATING
170th/ 347
METRIC RANK
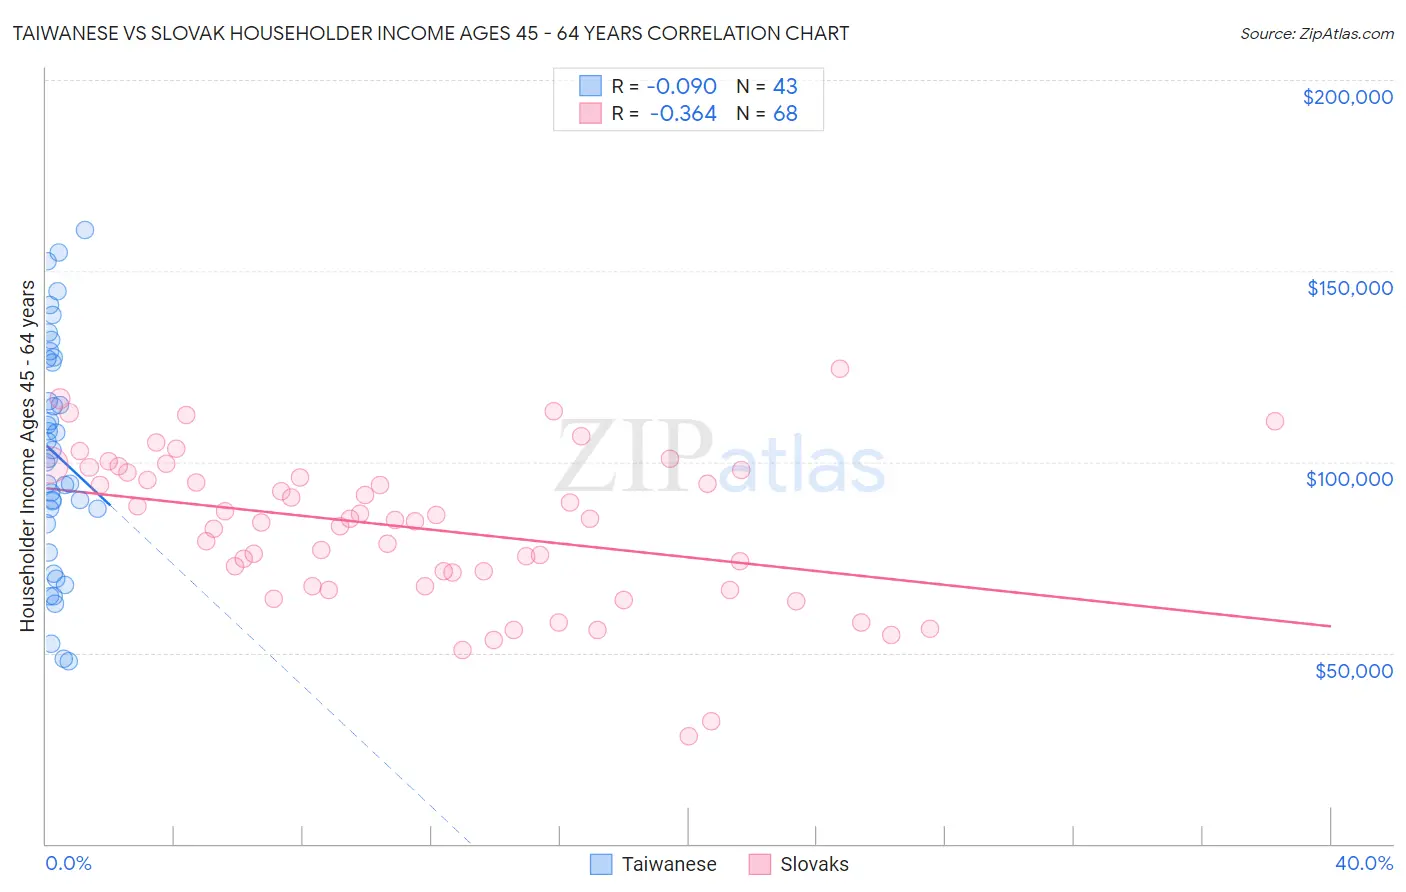
Taiwanese vs Slovak Householder Income Ages 45 - 64 years Correlation Chart
The statistical analysis conducted on geographies consisting of 31,709,295 people shows a slight negative correlation between the proportion of Taiwanese and household income with householder between the ages 45 and 64 in the United States with a correlation coefficient (R) of -0.090 and weighted average of $104,180. Similarly, the statistical analysis conducted on geographies consisting of 397,139,632 people shows a mild negative correlation between the proportion of Slovaks and household income with householder between the ages 45 and 64 in the United States with a correlation coefficient (R) of -0.364 and weighted average of $101,029, a difference of 3.1%.
Householder Income Ages 45 - 64 years Correlation Summary
| Measurement | Taiwanese | Slovak |
| Minimum | $47,813 | $28,125 |
| Maximum | $160,833 | $124,318 |
| Range | $113,020 | $96,193 |
| Mean | $102,027 | $82,752 |
| Median | $100,891 | $84,870 |
| Interquartile 25% (IQ1) | $83,846 | $69,341 |
| Interquartile 75% (IQ3) | $126,896 | $97,616 |
| Interquartile Range (IQR) | $43,050 | $28,275 |
| Standard Deviation (Sample) | $29,530 | $19,751 |
| Standard Deviation (Population) | $29,184 | $19,605 |
Similar Demographics by Householder Income Ages 45 - 64 years
Demographics Similar to Taiwanese by Householder Income Ages 45 - 64 years
In terms of householder income ages 45 - 64 years, the demographic groups most similar to Taiwanese are Brazilian ($104,408, a difference of 0.22%), Hungarian ($103,913, a difference of 0.26%), Canadian ($104,560, a difference of 0.36%), Arab ($104,566, a difference of 0.37%), and Ethiopian ($103,736, a difference of 0.43%).
| Demographics | Rating | Rank | Householder Income Ages 45 - 64 years |
| Peruvians | 91.5 /100 | #129 | Exceptional $105,070 |
| Immigrants | Zimbabwe | 91.2 /100 | #130 | Exceptional $104,992 |
| Immigrants | Syria | 90.7 /100 | #131 | Exceptional $104,858 |
| Lebanese | 90.1 /100 | #132 | Exceptional $104,734 |
| Arabs | 89.3 /100 | #133 | Excellent $104,566 |
| Canadians | 89.3 /100 | #134 | Excellent $104,560 |
| Brazilians | 88.6 /100 | #135 | Excellent $104,408 |
| Taiwanese | 87.4 /100 | #136 | Excellent $104,180 |
| Hungarians | 85.8 /100 | #137 | Excellent $103,913 |
| Ethiopians | 84.7 /100 | #138 | Excellent $103,736 |
| Immigrants | Oceania | 84.5 /100 | #139 | Excellent $103,705 |
| Norwegians | 84.3 /100 | #140 | Excellent $103,682 |
| Immigrants | Uganda | 83.7 /100 | #141 | Excellent $103,584 |
| Luxembourgers | 83.3 /100 | #142 | Excellent $103,536 |
| Serbians | 83.2 /100 | #143 | Excellent $103,522 |
Demographics Similar to Slovaks by Householder Income Ages 45 - 64 years
In terms of householder income ages 45 - 64 years, the demographic groups most similar to Slovaks are South American Indian ($101,171, a difference of 0.14%), Guamanian/Chamorro ($101,170, a difference of 0.14%), South American ($100,837, a difference of 0.19%), Czechoslovakian ($101,387, a difference of 0.35%), and Immigrants from Uzbekistan ($100,523, a difference of 0.50%).
| Demographics | Rating | Rank | Householder Income Ages 45 - 64 years |
| English | 70.1 /100 | #163 | Good $102,021 |
| Immigrants | Morocco | 70.0 /100 | #164 | Good $102,015 |
| Immigrants | Albania | 69.4 /100 | #165 | Good $101,957 |
| Samoans | 65.3 /100 | #166 | Good $101,580 |
| Czechoslovakians | 63.0 /100 | #167 | Good $101,387 |
| South American Indians | 60.5 /100 | #168 | Good $101,171 |
| Guamanians/Chamorros | 60.5 /100 | #169 | Good $101,170 |
| Slovaks | 58.8 /100 | #170 | Average $101,029 |
| South Americans | 56.4 /100 | #171 | Average $100,837 |
| Immigrants | Uzbekistan | 52.5 /100 | #172 | Average $100,523 |
| Alsatians | 51.4 /100 | #173 | Average $100,435 |
| Welsh | 50.0 /100 | #174 | Average $100,322 |
| Germans | 48.8 /100 | #175 | Average $100,224 |
| Immigrants | Costa Rica | 47.7 /100 | #176 | Average $100,141 |
| Moroccans | 47.7 /100 | #177 | Average $100,138 |