Pennsylvania German vs Cherokee Median Earnings
COMPARE
Pennsylvania German
Cherokee
Median Earnings
Median Earnings Comparison
Pennsylvania Germans
Cherokee
$42,615
MEDIAN EARNINGS
0.5/ 100
METRIC RATING
271st/ 347
METRIC RANK
$41,252
MEDIAN EARNINGS
0.1/ 100
METRIC RATING
296th/ 347
METRIC RANK
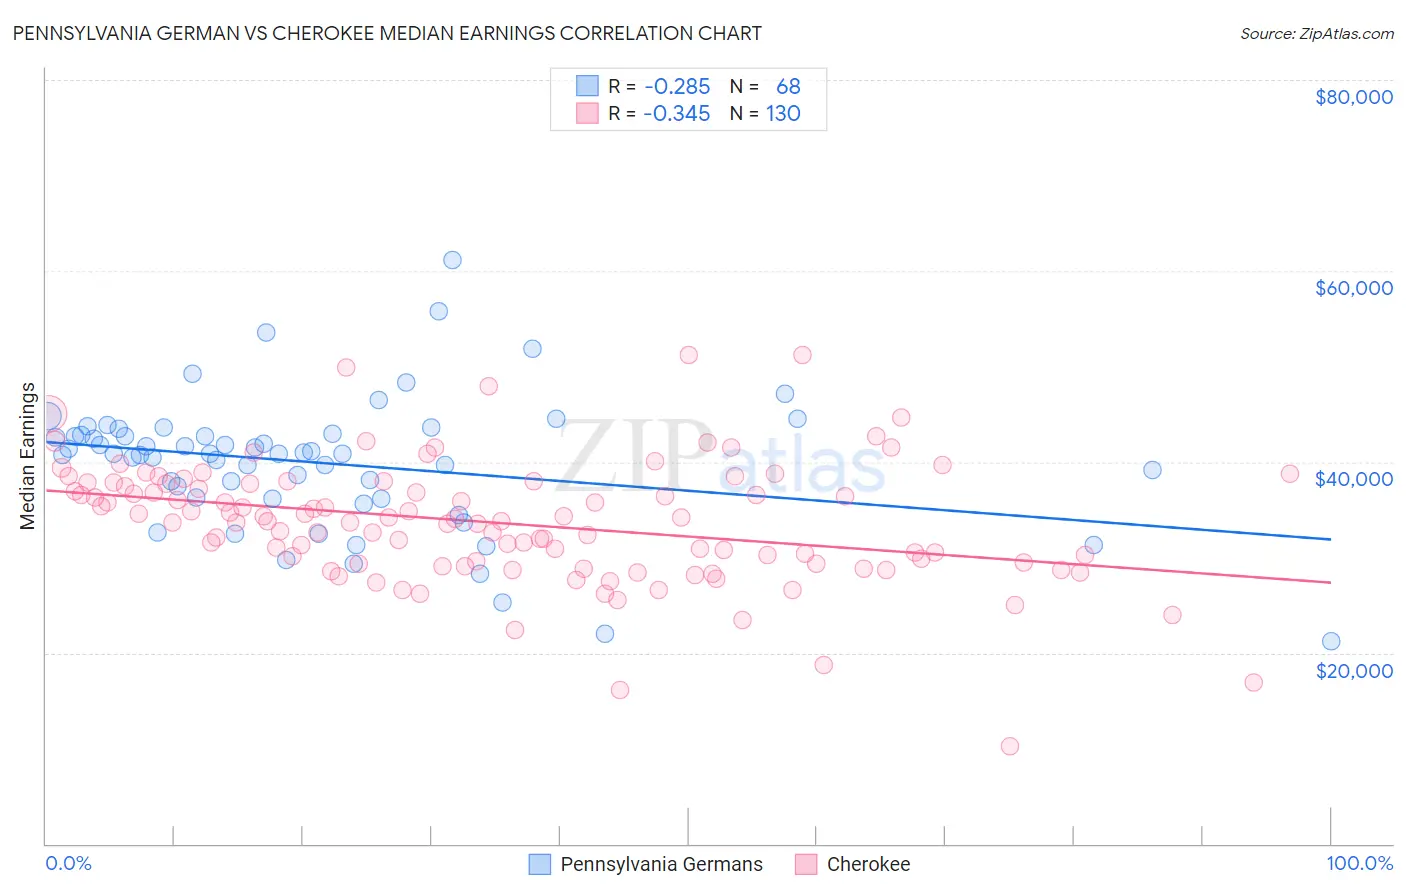
Pennsylvania German vs Cherokee Median Earnings Correlation Chart
The statistical analysis conducted on geographies consisting of 234,087,071 people shows a weak negative correlation between the proportion of Pennsylvania Germans and median earnings in the United States with a correlation coefficient (R) of -0.285 and weighted average of $42,615. Similarly, the statistical analysis conducted on geographies consisting of 493,557,174 people shows a mild negative correlation between the proportion of Cherokee and median earnings in the United States with a correlation coefficient (R) of -0.345 and weighted average of $41,252, a difference of 3.3%.
Median Earnings Correlation Summary
| Measurement | Pennsylvania German | Cherokee |
| Minimum | $21,250 | $10,267 |
| Maximum | $61,146 | $51,250 |
| Range | $39,896 | $40,983 |
| Mean | $39,881 | $33,603 |
| Median | $40,836 | $33,784 |
| Interquartile 25% (IQ1) | $36,214 | $29,375 |
| Interquartile 75% (IQ3) | $42,893 | $37,767 |
| Interquartile Range (IQR) | $6,679 | $8,392 |
| Standard Deviation (Sample) | $6,983 | $6,429 |
| Standard Deviation (Population) | $6,932 | $6,404 |
Similar Demographics by Median Earnings
Demographics Similar to Pennsylvania Germans by Median Earnings
In terms of median earnings, the demographic groups most similar to Pennsylvania Germans are Osage ($42,651, a difference of 0.090%), Belizean ($42,702, a difference of 0.21%), American ($42,742, a difference of 0.30%), Cree ($42,777, a difference of 0.38%), and Iroquois ($42,430, a difference of 0.43%).
| Demographics | Rating | Rank | Median Earnings |
| Immigrants | Liberia | 0.7 /100 | #264 | Tragic $42,923 |
| Salvadorans | 0.7 /100 | #265 | Tragic $42,912 |
| Immigrants | Laos | 0.7 /100 | #266 | Tragic $42,884 |
| Cree | 0.6 /100 | #267 | Tragic $42,777 |
| Americans | 0.6 /100 | #268 | Tragic $42,742 |
| Belizeans | 0.5 /100 | #269 | Tragic $42,702 |
| Osage | 0.5 /100 | #270 | Tragic $42,651 |
| Pennsylvania Germans | 0.5 /100 | #271 | Tragic $42,615 |
| Iroquois | 0.4 /100 | #272 | Tragic $42,430 |
| Immigrants | Dominica | 0.4 /100 | #273 | Tragic $42,420 |
| Immigrants | El Salvador | 0.4 /100 | #274 | Tragic $42,413 |
| Immigrants | Belize | 0.3 /100 | #275 | Tragic $42,339 |
| Spanish Americans | 0.3 /100 | #276 | Tragic $42,316 |
| Central Americans | 0.3 /100 | #277 | Tragic $42,280 |
| Cajuns | 0.3 /100 | #278 | Tragic $42,189 |
Demographics Similar to Cherokee by Median Earnings
In terms of median earnings, the demographic groups most similar to Cherokee are Bangladeshi ($41,263, a difference of 0.030%), Potawatomi ($41,288, a difference of 0.090%), Guatemalan ($41,205, a difference of 0.11%), Immigrants from Zaire ($41,325, a difference of 0.18%), and Immigrants from Micronesia ($41,133, a difference of 0.29%).
| Demographics | Rating | Rank | Median Earnings |
| Comanche | 0.1 /100 | #289 | Tragic $41,519 |
| Paiute | 0.1 /100 | #290 | Tragic $41,508 |
| Central American Indians | 0.1 /100 | #291 | Tragic $41,474 |
| U.S. Virgin Islanders | 0.1 /100 | #292 | Tragic $41,448 |
| Immigrants | Zaire | 0.1 /100 | #293 | Tragic $41,325 |
| Potawatomi | 0.1 /100 | #294 | Tragic $41,288 |
| Bangladeshis | 0.1 /100 | #295 | Tragic $41,263 |
| Cherokee | 0.1 /100 | #296 | Tragic $41,252 |
| Guatemalans | 0.1 /100 | #297 | Tragic $41,205 |
| Immigrants | Micronesia | 0.1 /100 | #298 | Tragic $41,133 |
| Immigrants | Caribbean | 0.1 /100 | #299 | Tragic $41,119 |
| Ute | 0.1 /100 | #300 | Tragic $41,051 |
| Immigrants | Latin America | 0.1 /100 | #301 | Tragic $41,049 |
| Shoshone | 0.0 /100 | #302 | Tragic $40,932 |
| Haitians | 0.0 /100 | #303 | Tragic $40,918 |