Immigrants from Africa vs Cherokee Median Earnings
COMPARE
Immigrants from Africa
Cherokee
Median Earnings
Median Earnings Comparison
Immigrants from Africa
Cherokee
$46,564
MEDIAN EARNINGS
54.6/ 100
METRIC RATING
168th/ 347
METRIC RANK
$41,252
MEDIAN EARNINGS
0.1/ 100
METRIC RATING
296th/ 347
METRIC RANK
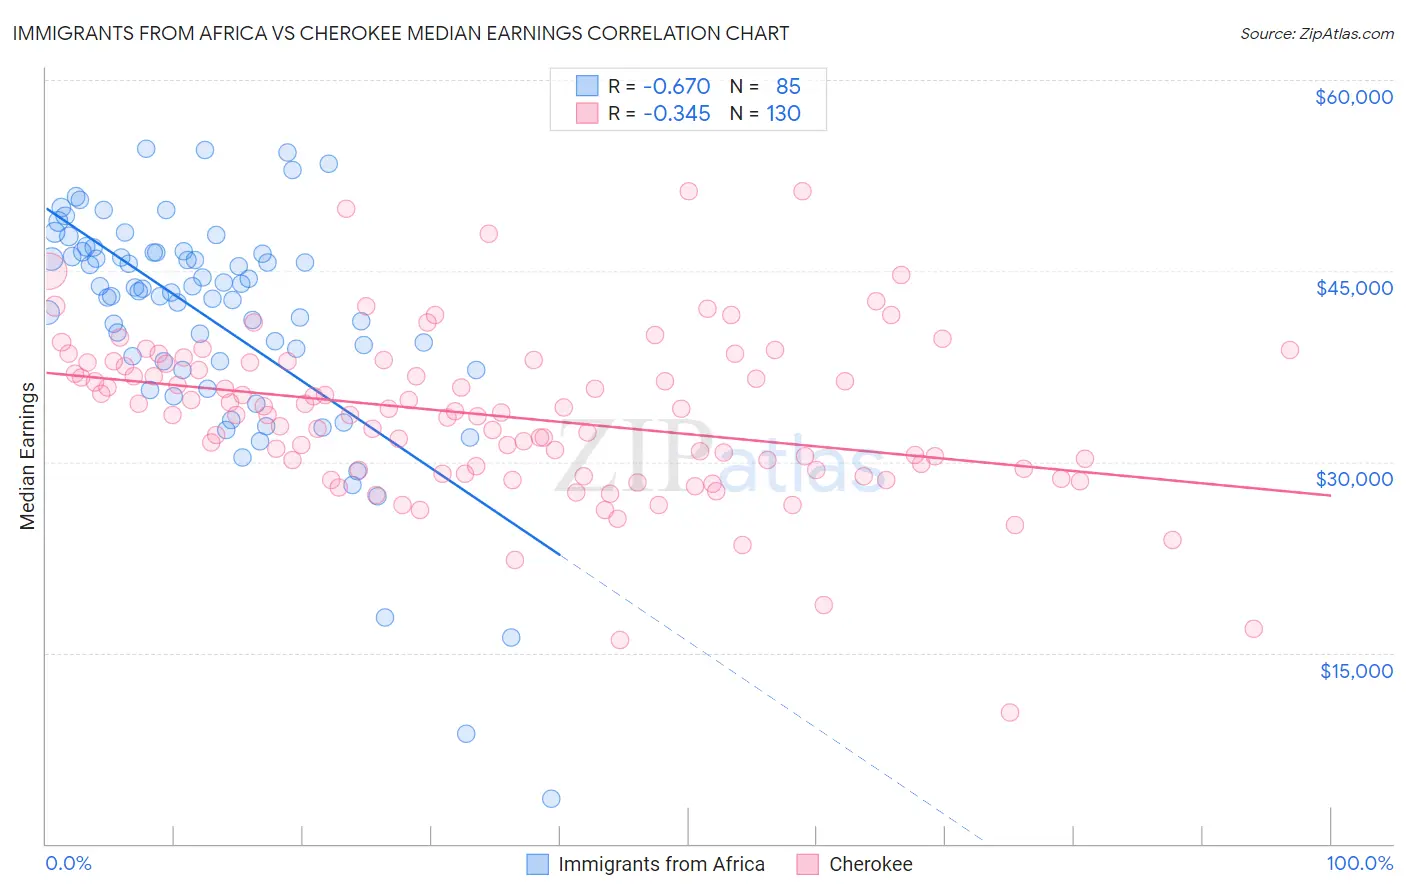
Immigrants from Africa vs Cherokee Median Earnings Correlation Chart
The statistical analysis conducted on geographies consisting of 469,401,841 people shows a significant negative correlation between the proportion of Immigrants from Africa and median earnings in the United States with a correlation coefficient (R) of -0.670 and weighted average of $46,564. Similarly, the statistical analysis conducted on geographies consisting of 493,557,174 people shows a mild negative correlation between the proportion of Cherokee and median earnings in the United States with a correlation coefficient (R) of -0.345 and weighted average of $41,252, a difference of 12.9%.
Median Earnings Correlation Summary
| Measurement | Immigrants from Africa | Cherokee |
| Minimum | $3,500 | $10,267 |
| Maximum | $54,639 | $51,250 |
| Range | $51,139 | $40,983 |
| Mean | $41,149 | $33,603 |
| Median | $43,417 | $33,784 |
| Interquartile 25% (IQ1) | $37,567 | $29,375 |
| Interquartile 75% (IQ3) | $46,460 | $37,767 |
| Interquartile Range (IQR) | $8,893 | $8,392 |
| Standard Deviation (Sample) | $9,174 | $6,429 |
| Standard Deviation (Population) | $9,120 | $6,404 |
Similar Demographics by Median Earnings
Demographics Similar to Immigrants from Africa by Median Earnings
In terms of median earnings, the demographic groups most similar to Immigrants from Africa are Immigrants from South America ($46,548, a difference of 0.030%), Costa Rican ($46,645, a difference of 0.17%), Immigrants ($46,478, a difference of 0.18%), Czechoslovakian ($46,658, a difference of 0.20%), and Scottish ($46,463, a difference of 0.22%).
| Demographics | Rating | Rank | Median Earnings |
| Immigrants | Eastern Africa | 68.0 /100 | #161 | Good $46,969 |
| South American Indians | 67.4 /100 | #162 | Good $46,952 |
| Icelanders | 66.3 /100 | #163 | Good $46,916 |
| Norwegians | 64.7 /100 | #164 | Good $46,865 |
| South Americans | 62.7 /100 | #165 | Good $46,804 |
| Czechoslovakians | 57.8 /100 | #166 | Average $46,658 |
| Costa Ricans | 57.4 /100 | #167 | Average $46,645 |
| Immigrants | Africa | 54.6 /100 | #168 | Average $46,564 |
| Immigrants | South America | 54.0 /100 | #169 | Average $46,548 |
| Immigrants | Immigrants | 51.6 /100 | #170 | Average $46,478 |
| Scottish | 51.1 /100 | #171 | Average $46,463 |
| Kenyans | 51.0 /100 | #172 | Average $46,462 |
| Ghanaians | 50.3 /100 | #173 | Average $46,440 |
| Scandinavians | 50.0 /100 | #174 | Average $46,433 |
| Basques | 48.8 /100 | #175 | Average $46,399 |
Demographics Similar to Cherokee by Median Earnings
In terms of median earnings, the demographic groups most similar to Cherokee are Bangladeshi ($41,263, a difference of 0.030%), Potawatomi ($41,288, a difference of 0.090%), Guatemalan ($41,205, a difference of 0.11%), Immigrants from Zaire ($41,325, a difference of 0.18%), and Immigrants from Micronesia ($41,133, a difference of 0.29%).
| Demographics | Rating | Rank | Median Earnings |
| Comanche | 0.1 /100 | #289 | Tragic $41,519 |
| Paiute | 0.1 /100 | #290 | Tragic $41,508 |
| Central American Indians | 0.1 /100 | #291 | Tragic $41,474 |
| U.S. Virgin Islanders | 0.1 /100 | #292 | Tragic $41,448 |
| Immigrants | Zaire | 0.1 /100 | #293 | Tragic $41,325 |
| Potawatomi | 0.1 /100 | #294 | Tragic $41,288 |
| Bangladeshis | 0.1 /100 | #295 | Tragic $41,263 |
| Cherokee | 0.1 /100 | #296 | Tragic $41,252 |
| Guatemalans | 0.1 /100 | #297 | Tragic $41,205 |
| Immigrants | Micronesia | 0.1 /100 | #298 | Tragic $41,133 |
| Immigrants | Caribbean | 0.1 /100 | #299 | Tragic $41,119 |
| Ute | 0.1 /100 | #300 | Tragic $41,051 |
| Immigrants | Latin America | 0.1 /100 | #301 | Tragic $41,049 |
| Shoshone | 0.0 /100 | #302 | Tragic $40,932 |
| Haitians | 0.0 /100 | #303 | Tragic $40,918 |