Swiss vs South American Master's Degree
COMPARE
Swiss
South American
Master's Degree
Master's Degree Comparison
Swiss
South Americans
14.7%
MASTER'S DEGREE
41.1/ 100
METRIC RATING
181st/ 347
METRIC RANK
15.6%
MASTER'S DEGREE
81.3/ 100
METRIC RATING
145th/ 347
METRIC RANK
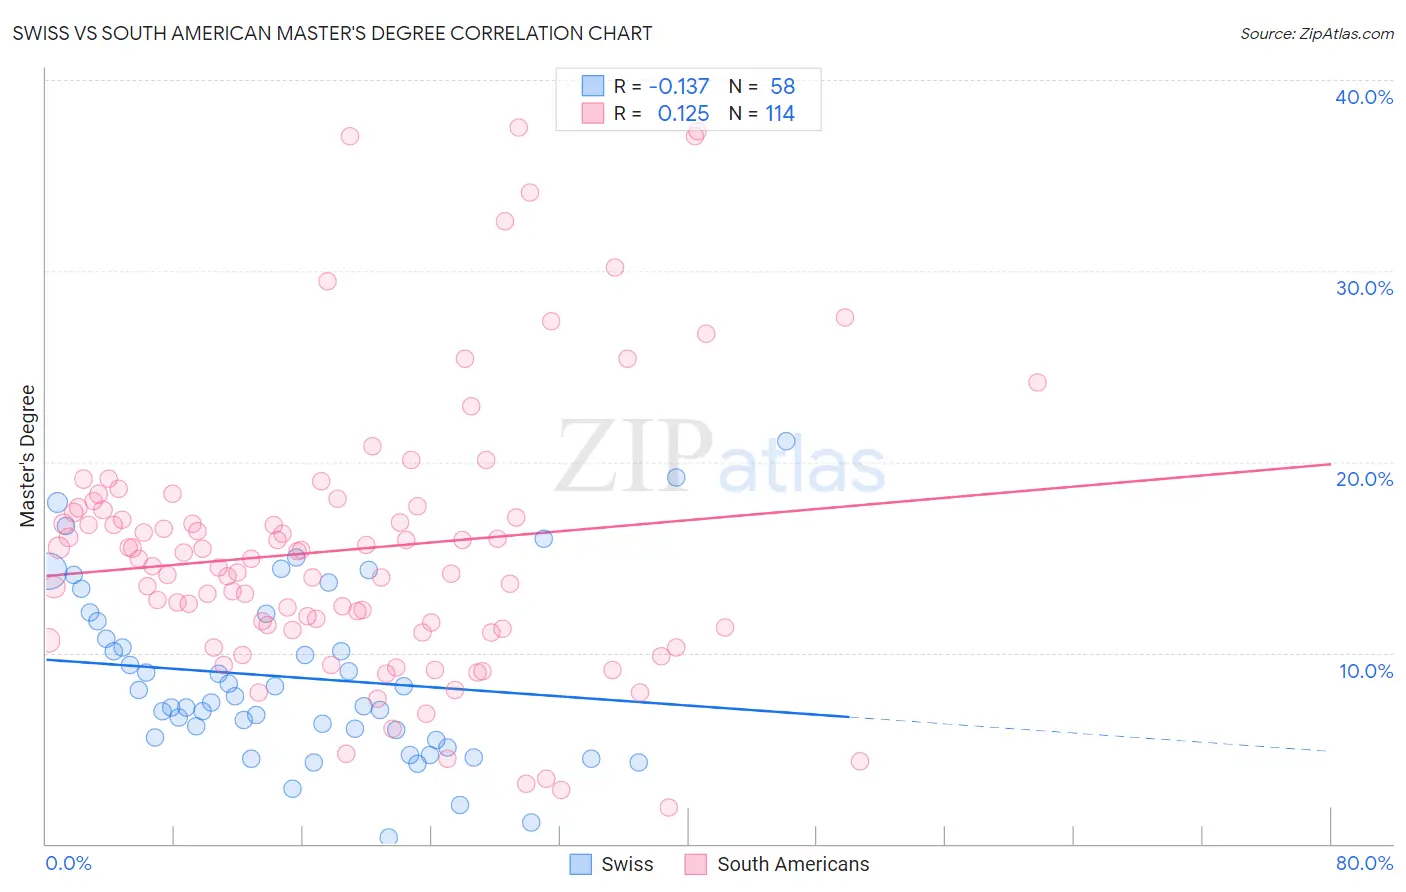
Swiss vs South American Master's Degree Correlation Chart
The statistical analysis conducted on geographies consisting of 464,796,332 people shows a poor negative correlation between the proportion of Swiss and percentage of population with at least master's degree education in the United States with a correlation coefficient (R) of -0.137 and weighted average of 14.7%. Similarly, the statistical analysis conducted on geographies consisting of 493,882,123 people shows a poor positive correlation between the proportion of South Americans and percentage of population with at least master's degree education in the United States with a correlation coefficient (R) of 0.125 and weighted average of 15.6%, a difference of 5.9%.
Master's Degree Correlation Summary
| Measurement | Swiss | South American |
| Minimum | 0.35% | 1.9% |
| Maximum | 21.1% | 37.5% |
| Range | 20.7% | 35.6% |
| Mean | 8.7% | 15.4% |
| Median | 7.6% | 14.7% |
| Interquartile 25% (IQ1) | 5.5% | 11.2% |
| Interquartile 75% (IQ3) | 11.6% | 17.5% |
| Interquartile Range (IQR) | 6.1% | 6.3% |
| Standard Deviation (Sample) | 4.5% | 7.3% |
| Standard Deviation (Population) | 4.5% | 7.3% |
Similar Demographics by Master's Degree
Demographics Similar to Swiss by Master's Degree
In terms of master's degree, the demographic groups most similar to Swiss are Celtic (14.8%, a difference of 0.020%), Immigrants from Iraq (14.8%, a difference of 0.030%), Czech (14.7%, a difference of 0.10%), Sri Lankan (14.7%, a difference of 0.20%), and Immigrants from Zaire (14.7%, a difference of 0.22%).
| Demographics | Rating | Rank | Master's Degree |
| Slovaks | 50.0 /100 | #174 | Average 14.9% |
| Immigrants | Peru | 49.6 /100 | #175 | Average 14.9% |
| Nigerians | 48.6 /100 | #176 | Average 14.9% |
| Immigrants | Colombia | 48.3 /100 | #177 | Average 14.9% |
| English | 45.0 /100 | #178 | Average 14.8% |
| Immigrants | Iraq | 41.3 /100 | #179 | Average 14.8% |
| Celtics | 41.3 /100 | #180 | Average 14.8% |
| Swiss | 41.1 /100 | #181 | Average 14.7% |
| Czechs | 40.4 /100 | #182 | Average 14.7% |
| Sri Lankans | 39.6 /100 | #183 | Fair 14.7% |
| Immigrants | Zaire | 39.5 /100 | #184 | Fair 14.7% |
| Barbadians | 38.3 /100 | #185 | Fair 14.7% |
| Immigrants | Oceania | 37.1 /100 | #186 | Fair 14.7% |
| Basques | 36.5 /100 | #187 | Fair 14.7% |
| Immigrants | Costa Rica | 36.2 /100 | #188 | Fair 14.7% |
Demographics Similar to South Americans by Master's Degree
In terms of master's degree, the demographic groups most similar to South Americans are Immigrants from Afghanistan (15.6%, a difference of 0.37%), Hungarian (15.6%, a difference of 0.41%), Canadian (15.7%, a difference of 0.42%), Immigrants from Venezuela (15.7%, a difference of 0.50%), and Immigrants from Senegal (15.5%, a difference of 0.58%).
| Demographics | Rating | Rank | Master's Degree |
| Pakistanis | 86.1 /100 | #138 | Excellent 15.8% |
| Immigrants | Germany | 85.9 /100 | #139 | Excellent 15.8% |
| Vietnamese | 85.5 /100 | #140 | Excellent 15.8% |
| Poles | 85.0 /100 | #141 | Excellent 15.7% |
| Immigrants | Africa | 84.0 /100 | #142 | Excellent 15.7% |
| Immigrants | Venezuela | 83.6 /100 | #143 | Excellent 15.7% |
| Canadians | 83.3 /100 | #144 | Excellent 15.7% |
| South Americans | 81.3 /100 | #145 | Excellent 15.6% |
| Immigrants | Afghanistan | 79.4 /100 | #146 | Good 15.6% |
| Hungarians | 79.1 /100 | #147 | Good 15.6% |
| Immigrants | Senegal | 78.2 /100 | #148 | Good 15.5% |
| Ghanaians | 78.2 /100 | #149 | Good 15.5% |
| Slovenes | 78.0 /100 | #150 | Good 15.5% |
| Iraqis | 77.3 /100 | #151 | Good 15.5% |
| Slavs | 77.0 /100 | #152 | Good 15.5% |