Swiss vs South American Per Capita Income
COMPARE
Swiss
South American
Per Capita Income
Per Capita Income Comparison
Swiss
South Americans
$44,076
PER CAPITA INCOME
61.4/ 100
METRIC RATING
162nd/ 347
METRIC RANK
$44,114
PER CAPITA INCOME
62.4/ 100
METRIC RATING
159th/ 347
METRIC RANK
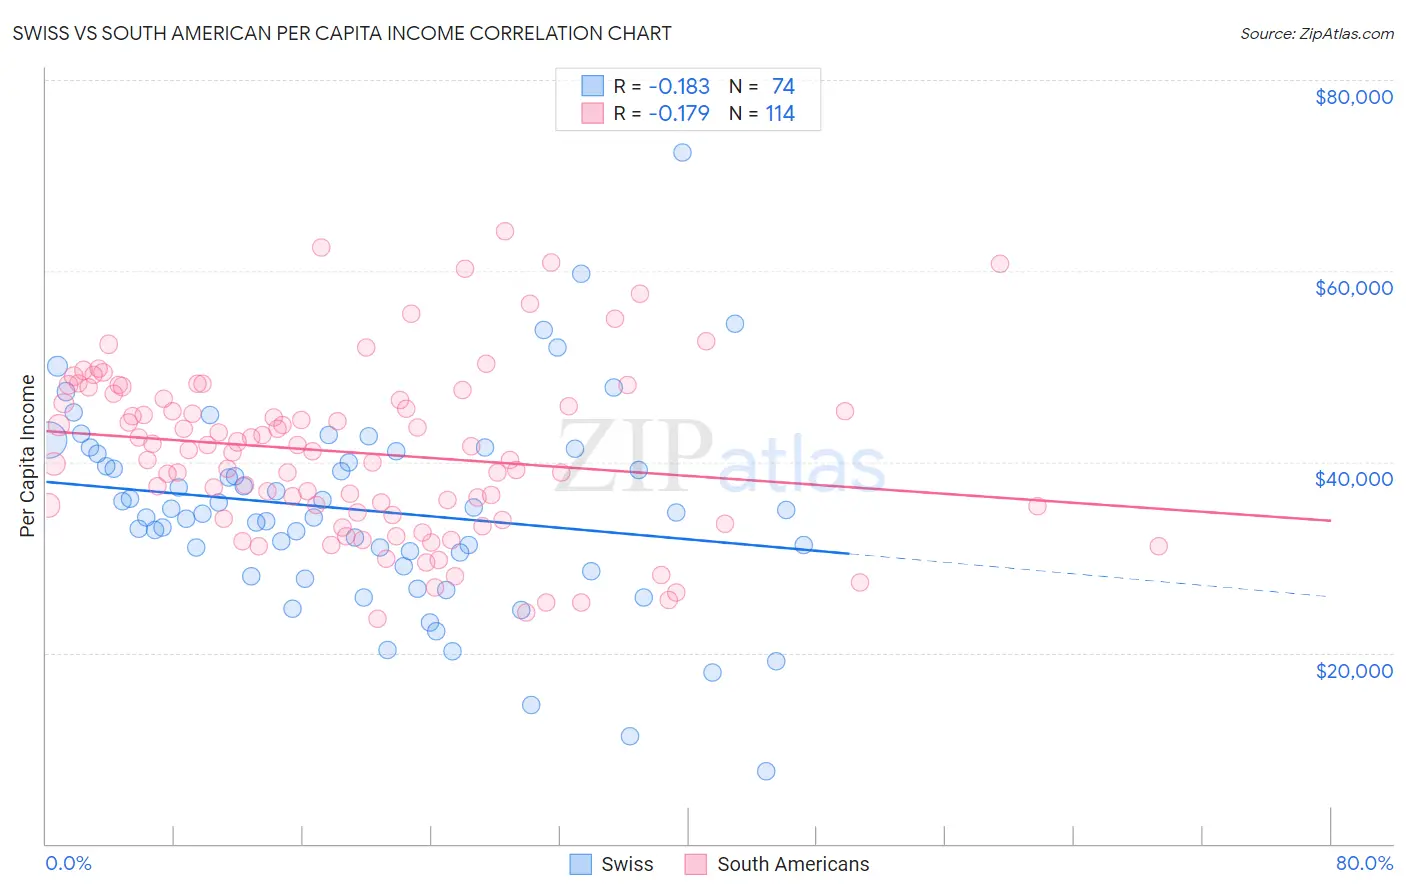
Swiss vs South American Per Capita Income Correlation Chart
The statistical analysis conducted on geographies consisting of 465,046,505 people shows a poor negative correlation between the proportion of Swiss and per capita income in the United States with a correlation coefficient (R) of -0.183 and weighted average of $44,076. Similarly, the statistical analysis conducted on geographies consisting of 494,145,698 people shows a poor negative correlation between the proportion of South Americans and per capita income in the United States with a correlation coefficient (R) of -0.179 and weighted average of $44,114, a difference of 0.090%.
Per Capita Income Correlation Summary
| Measurement | Swiss | South American |
| Minimum | $7,533 | $23,579 |
| Maximum | $72,391 | $64,213 |
| Range | $64,858 | $40,635 |
| Mean | $34,911 | $40,955 |
| Median | $34,649 | $41,221 |
| Interquartile 25% (IQ1) | $29,057 | $34,406 |
| Interquartile 75% (IQ3) | $40,868 | $46,619 |
| Interquartile Range (IQR) | $11,811 | $12,213 |
| Standard Deviation (Sample) | $10,600 | $8,864 |
| Standard Deviation (Population) | $10,528 | $8,825 |
Demographics Similar to Swiss and South Americans by Per Capita Income
In terms of per capita income, the demographic groups most similar to Swiss are Immigrants from South America ($44,068, a difference of 0.020%), Costa Rican ($44,090, a difference of 0.030%), Danish ($44,095, a difference of 0.040%), Sri Lankan ($44,014, a difference of 0.14%), and Immigrants from Philippines ($44,000, a difference of 0.17%). Similarly, the demographic groups most similar to South Americans are Danish ($44,095, a difference of 0.040%), Costa Rican ($44,090, a difference of 0.050%), Immigrants from South America ($44,068, a difference of 0.10%), Immigrants from Nepal ($44,187, a difference of 0.17%), and South American Indian ($44,206, a difference of 0.21%).
| Demographics | Rating | Rank | Per Capita Income |
| Immigrants | Eritrea | 72.1 /100 | #150 | Good $44,509 |
| Norwegians | 71.5 /100 | #151 | Good $44,480 |
| Peruvians | 71.5 /100 | #152 | Good $44,479 |
| Scottish | 70.6 /100 | #153 | Good $44,440 |
| Portuguese | 68.7 /100 | #154 | Good $44,362 |
| Uruguayans | 67.6 /100 | #155 | Good $44,318 |
| Slovaks | 65.4 /100 | #156 | Good $44,229 |
| South American Indians | 64.8 /100 | #157 | Good $44,206 |
| Immigrants | Nepal | 64.3 /100 | #158 | Good $44,187 |
| South Americans | 62.4 /100 | #159 | Good $44,114 |
| Danes | 61.9 /100 | #160 | Good $44,095 |
| Costa Ricans | 61.8 /100 | #161 | Good $44,090 |
| Swiss | 61.4 /100 | #162 | Good $44,076 |
| Immigrants | South America | 61.2 /100 | #163 | Good $44,068 |
| Sri Lankans | 59.8 /100 | #164 | Average $44,014 |
| Immigrants | Philippines | 59.4 /100 | #165 | Average $44,000 |
| Immigrants | Uruguay | 59.3 /100 | #166 | Average $43,997 |
| English | 58.9 /100 | #167 | Average $43,982 |
| Belgians | 58.1 /100 | #168 | Average $43,951 |
| Immigrants | Peru | 55.3 /100 | #169 | Average $43,852 |
| Scandinavians | 55.2 /100 | #170 | Average $43,848 |