Immigrants from Syria vs South American Householder Income Ages 45 - 64 years
COMPARE
Immigrants from Syria
South American
Householder Income Ages 45 - 64 years
Householder Income Ages 45 - 64 years Comparison
Immigrants from Syria
South Americans
$104,858
HOUSEHOLDER INCOME AGES 45 - 64 YEARS
90.7/ 100
METRIC RATING
131st/ 347
METRIC RANK
$100,837
HOUSEHOLDER INCOME AGES 45 - 64 YEARS
56.4/ 100
METRIC RATING
171st/ 347
METRIC RANK
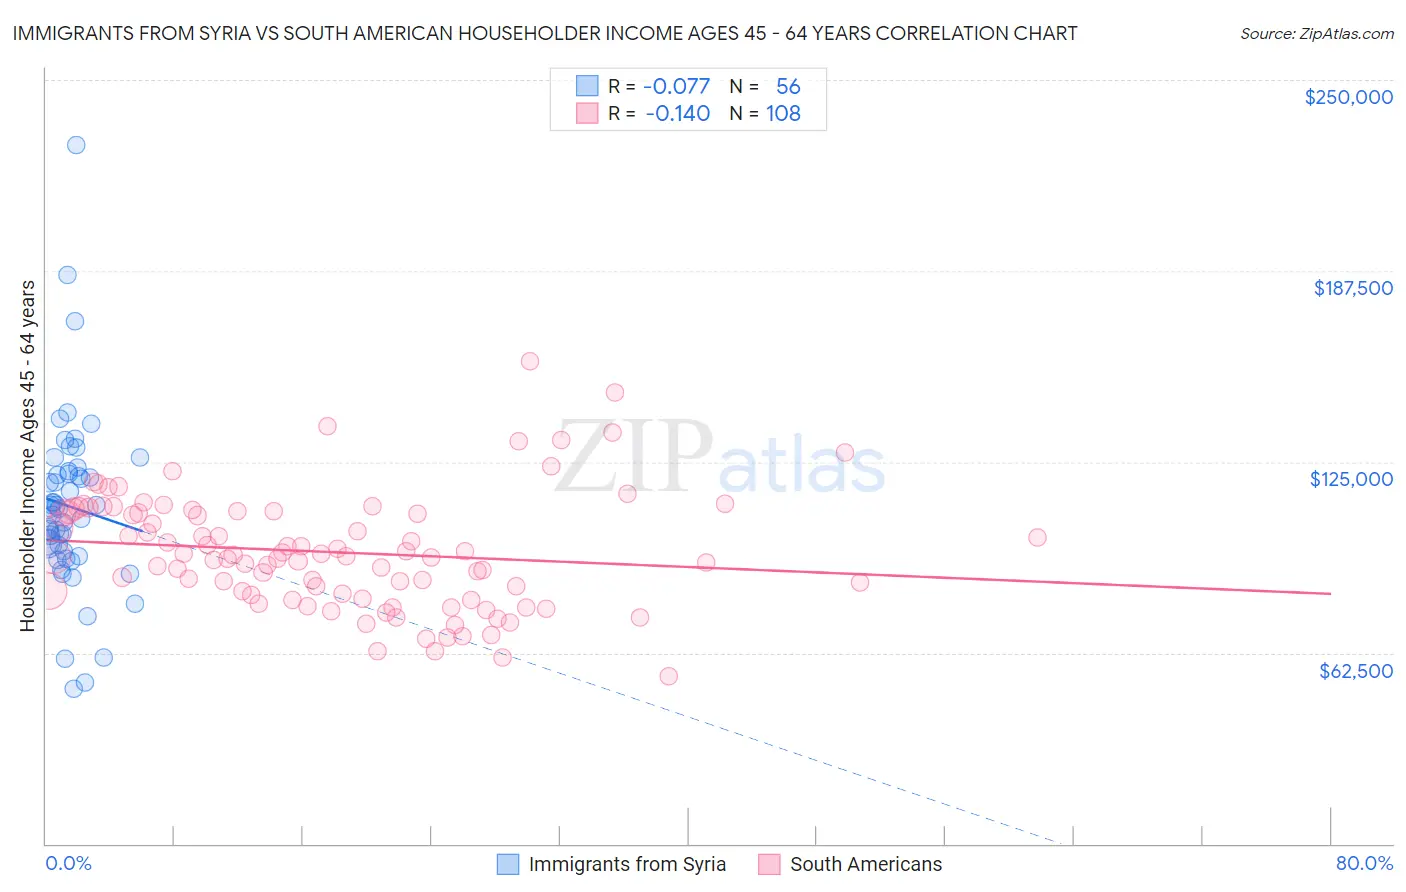
Immigrants from Syria vs South American Householder Income Ages 45 - 64 years Correlation Chart
The statistical analysis conducted on geographies consisting of 174,068,241 people shows a slight negative correlation between the proportion of Immigrants from Syria and household income with householder between the ages 45 and 64 in the United States with a correlation coefficient (R) of -0.077 and weighted average of $104,858. Similarly, the statistical analysis conducted on geographies consisting of 492,624,098 people shows a poor negative correlation between the proportion of South Americans and household income with householder between the ages 45 and 64 in the United States with a correlation coefficient (R) of -0.140 and weighted average of $100,837, a difference of 4.0%.
Householder Income Ages 45 - 64 years Correlation Summary
| Measurement | Immigrants from Syria | South American |
| Minimum | $50,774 | $54,659 |
| Maximum | $228,894 | $158,009 |
| Range | $178,120 | $103,350 |
| Mean | $110,346 | $95,419 |
| Median | $109,693 | $93,921 |
| Interquartile 25% (IQ1) | $94,783 | $81,601 |
| Interquartile 75% (IQ3) | $121,434 | $108,663 |
| Interquartile Range (IQR) | $26,651 | $27,062 |
| Standard Deviation (Sample) | $29,383 | $18,909 |
| Standard Deviation (Population) | $29,119 | $18,822 |
Similar Demographics by Householder Income Ages 45 - 64 years
Demographics Similar to Immigrants from Syria by Householder Income Ages 45 - 64 years
In terms of householder income ages 45 - 64 years, the demographic groups most similar to Immigrants from Syria are Lebanese ($104,734, a difference of 0.12%), Immigrants from Zimbabwe ($104,992, a difference of 0.13%), Peruvian ($105,070, a difference of 0.20%), Native Hawaiian ($105,149, a difference of 0.28%), and Arab ($104,566, a difference of 0.28%).
| Demographics | Rating | Rank | Householder Income Ages 45 - 64 years |
| Immigrants | Northern Africa | 92.8 /100 | #124 | Exceptional $105,430 |
| Pakistanis | 92.4 /100 | #125 | Exceptional $105,317 |
| Portuguese | 92.4 /100 | #126 | Exceptional $105,309 |
| Immigrants | Saudi Arabia | 92.2 /100 | #127 | Exceptional $105,249 |
| Native Hawaiians | 91.8 /100 | #128 | Exceptional $105,149 |
| Peruvians | 91.5 /100 | #129 | Exceptional $105,070 |
| Immigrants | Zimbabwe | 91.2 /100 | #130 | Exceptional $104,992 |
| Immigrants | Syria | 90.7 /100 | #131 | Exceptional $104,858 |
| Lebanese | 90.1 /100 | #132 | Exceptional $104,734 |
| Arabs | 89.3 /100 | #133 | Excellent $104,566 |
| Canadians | 89.3 /100 | #134 | Excellent $104,560 |
| Brazilians | 88.6 /100 | #135 | Excellent $104,408 |
| Taiwanese | 87.4 /100 | #136 | Excellent $104,180 |
| Hungarians | 85.8 /100 | #137 | Excellent $103,913 |
| Ethiopians | 84.7 /100 | #138 | Excellent $103,736 |
Demographics Similar to South Americans by Householder Income Ages 45 - 64 years
In terms of householder income ages 45 - 64 years, the demographic groups most similar to South Americans are Slovak ($101,029, a difference of 0.19%), Immigrants from Uzbekistan ($100,523, a difference of 0.31%), South American Indian ($101,171, a difference of 0.33%), Guamanian/Chamorro ($101,170, a difference of 0.33%), and Alsatian ($100,435, a difference of 0.40%).
| Demographics | Rating | Rank | Householder Income Ages 45 - 64 years |
| Immigrants | Morocco | 70.0 /100 | #164 | Good $102,015 |
| Immigrants | Albania | 69.4 /100 | #165 | Good $101,957 |
| Samoans | 65.3 /100 | #166 | Good $101,580 |
| Czechoslovakians | 63.0 /100 | #167 | Good $101,387 |
| South American Indians | 60.5 /100 | #168 | Good $101,171 |
| Guamanians/Chamorros | 60.5 /100 | #169 | Good $101,170 |
| Slovaks | 58.8 /100 | #170 | Average $101,029 |
| South Americans | 56.4 /100 | #171 | Average $100,837 |
| Immigrants | Uzbekistan | 52.5 /100 | #172 | Average $100,523 |
| Alsatians | 51.4 /100 | #173 | Average $100,435 |
| Welsh | 50.0 /100 | #174 | Average $100,322 |
| Germans | 48.8 /100 | #175 | Average $100,224 |
| Immigrants | Costa Rica | 47.7 /100 | #176 | Average $100,141 |
| Moroccans | 47.7 /100 | #177 | Average $100,138 |
| Immigrants | Cameroon | 47.0 /100 | #178 | Average $100,084 |