Pakistani vs Slovene Median Household Income
COMPARE
Pakistani
Slovene
Median Household Income
Median Household Income Comparison
Pakistanis
Slovenes
$89,638
MEDIAN HOUSEHOLD INCOME
94.8/ 100
METRIC RATING
122nd/ 347
METRIC RANK
$85,562
MEDIAN HOUSEHOLD INCOME
57.4/ 100
METRIC RATING
172nd/ 347
METRIC RANK
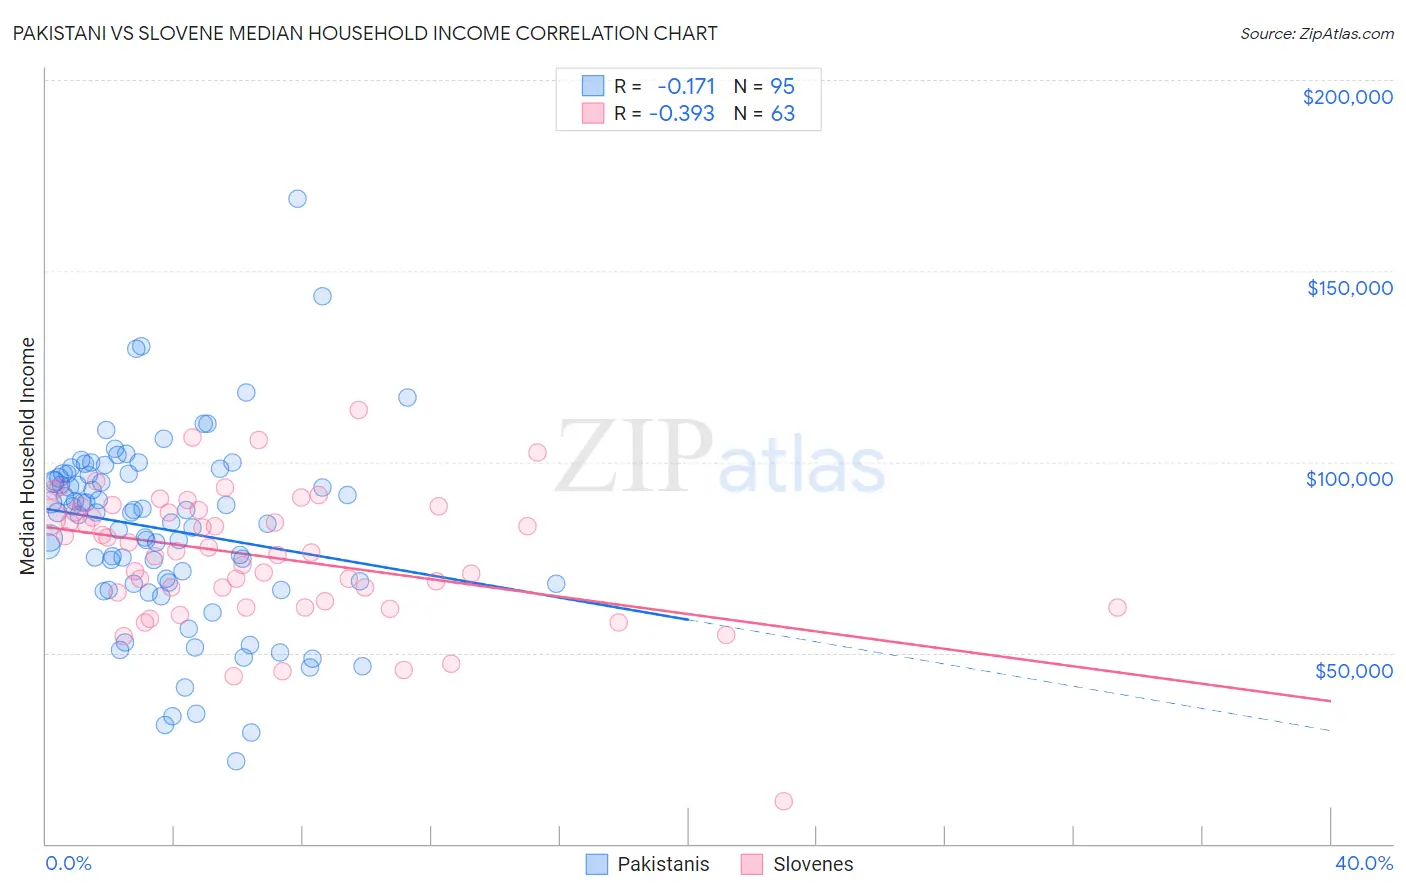
Pakistani vs Slovene Median Household Income Correlation Chart
The statistical analysis conducted on geographies consisting of 335,154,769 people shows a poor negative correlation between the proportion of Pakistanis and median household income in the United States with a correlation coefficient (R) of -0.171 and weighted average of $89,638. Similarly, the statistical analysis conducted on geographies consisting of 261,226,883 people shows a mild negative correlation between the proportion of Slovenes and median household income in the United States with a correlation coefficient (R) of -0.393 and weighted average of $85,562, a difference of 4.8%.
Median Household Income Correlation Summary
| Measurement | Pakistani | Slovene |
| Minimum | $21,500 | $11,161 |
| Maximum | $169,063 | $113,650 |
| Range | $147,563 | $102,489 |
| Mean | $82,388 | $75,280 |
| Median | $86,853 | $76,693 |
| Interquartile 25% (IQ1) | $68,125 | $63,438 |
| Interquartile 75% (IQ3) | $96,894 | $87,449 |
| Interquartile Range (IQR) | $28,769 | $24,011 |
| Standard Deviation (Sample) | $24,553 | $17,550 |
| Standard Deviation (Population) | $24,423 | $17,410 |
Similar Demographics by Median Household Income
Demographics Similar to Pakistanis by Median Household Income
In terms of median household income, the demographic groups most similar to Pakistanis are Ethiopian ($89,640, a difference of 0.0%), Immigrants from North Macedonia ($89,741, a difference of 0.11%), Albanian ($89,744, a difference of 0.12%), Immigrants from Zimbabwe ($89,496, a difference of 0.16%), and Syrian ($89,830, a difference of 0.21%).
| Demographics | Rating | Rank | Median Household Income |
| Immigrants | Western Asia | 95.9 /100 | #115 | Exceptional $90,005 |
| Native Hawaiians | 95.7 /100 | #116 | Exceptional $89,919 |
| Taiwanese | 95.6 /100 | #117 | Exceptional $89,900 |
| Syrians | 95.4 /100 | #118 | Exceptional $89,830 |
| Albanians | 95.2 /100 | #119 | Exceptional $89,744 |
| Immigrants | North Macedonia | 95.2 /100 | #120 | Exceptional $89,741 |
| Ethiopians | 94.9 /100 | #121 | Exceptional $89,640 |
| Pakistanis | 94.8 /100 | #122 | Exceptional $89,638 |
| Immigrants | Zimbabwe | 94.4 /100 | #123 | Exceptional $89,496 |
| Immigrants | Jordan | 94.1 /100 | #124 | Exceptional $89,412 |
| Immigrants | Kuwait | 93.5 /100 | #125 | Exceptional $89,263 |
| Immigrants | Oceania | 92.9 /100 | #126 | Exceptional $89,100 |
| Immigrants | Peru | 92.5 /100 | #127 | Exceptional $89,010 |
| Portuguese | 92.3 /100 | #128 | Exceptional $88,976 |
| Brazilians | 92.1 /100 | #129 | Exceptional $88,934 |
Demographics Similar to Slovenes by Median Household Income
In terms of median household income, the demographic groups most similar to Slovenes are Immigrants from South America ($85,611, a difference of 0.060%), Swiss ($85,681, a difference of 0.14%), Colombian ($85,716, a difference of 0.18%), Icelander ($85,797, a difference of 0.27%), and Immigrants from Cameroon ($85,314, a difference of 0.29%).
| Demographics | Rating | Rank | Median Household Income |
| Norwegians | 65.3 /100 | #165 | Good $86,084 |
| Scandinavians | 65.1 /100 | #166 | Good $86,073 |
| Immigrants | Immigrants | 61.3 /100 | #167 | Good $85,818 |
| Icelanders | 61.0 /100 | #168 | Good $85,797 |
| Colombians | 59.7 /100 | #169 | Average $85,716 |
| Swiss | 59.2 /100 | #170 | Average $85,681 |
| Immigrants | South America | 58.1 /100 | #171 | Average $85,611 |
| Slovenes | 57.4 /100 | #172 | Average $85,562 |
| Immigrants | Cameroon | 53.4 /100 | #173 | Average $85,314 |
| Scottish | 50.0 /100 | #174 | Average $85,101 |
| Immigrants | Costa Rica | 49.2 /100 | #175 | Average $85,054 |
| Alsatians | 49.2 /100 | #176 | Average $85,053 |
| Immigrants | Eritrea | 48.8 /100 | #177 | Average $85,025 |
| Czechoslovakians | 47.8 /100 | #178 | Average $84,965 |
| English | 47.0 /100 | #179 | Average $84,915 |