South American vs Slovene Median Household Income
COMPARE
South American
Slovene
Median Household Income
Median Household Income Comparison
South Americans
Slovenes
$86,824
MEDIAN HOUSEHOLD INCOME
75.1/ 100
METRIC RATING
153rd/ 347
METRIC RANK
$85,562
MEDIAN HOUSEHOLD INCOME
57.4/ 100
METRIC RATING
172nd/ 347
METRIC RANK
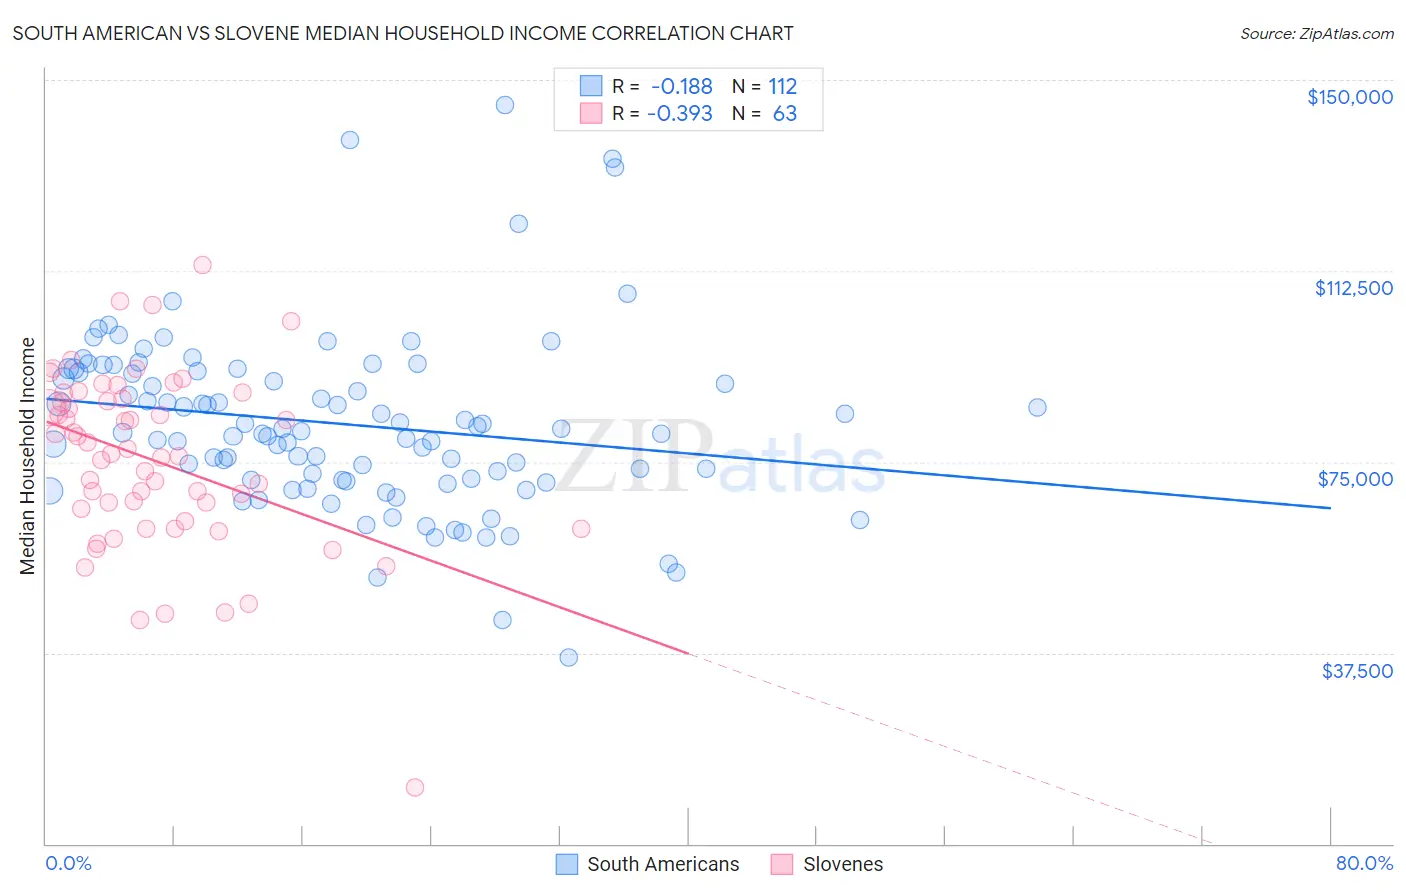
South American vs Slovene Median Household Income Correlation Chart
The statistical analysis conducted on geographies consisting of 493,431,068 people shows a poor negative correlation between the proportion of South Americans and median household income in the United States with a correlation coefficient (R) of -0.188 and weighted average of $86,824. Similarly, the statistical analysis conducted on geographies consisting of 261,226,883 people shows a mild negative correlation between the proportion of Slovenes and median household income in the United States with a correlation coefficient (R) of -0.393 and weighted average of $85,562, a difference of 1.5%.
Median Household Income Correlation Summary
| Measurement | South American | Slovene |
| Minimum | $36,563 | $11,161 |
| Maximum | $145,121 | $113,650 |
| Range | $108,558 | $102,489 |
| Mean | $82,451 | $75,280 |
| Median | $80,811 | $76,693 |
| Interquartile 25% (IQ1) | $71,448 | $63,438 |
| Interquartile 75% (IQ3) | $92,775 | $87,449 |
| Interquartile Range (IQR) | $21,327 | $24,011 |
| Standard Deviation (Sample) | $17,445 | $17,550 |
| Standard Deviation (Population) | $17,367 | $17,410 |
Demographics Similar to South Americans and Slovenes by Median Household Income
In terms of median household income, the demographic groups most similar to South Americans are Immigrants from Saudi Arabia ($86,875, a difference of 0.060%), Immigrants from Germany ($86,764, a difference of 0.070%), Carpatho Rusyn ($86,635, a difference of 0.22%), Immigrants from Albania ($86,534, a difference of 0.33%), and Samoan ($86,498, a difference of 0.38%). Similarly, the demographic groups most similar to Slovenes are Immigrants from South America ($85,611, a difference of 0.060%), Swiss ($85,681, a difference of 0.14%), Colombian ($85,716, a difference of 0.18%), Icelander ($85,797, a difference of 0.27%), and Immigrants ($85,818, a difference of 0.30%).
| Demographics | Rating | Rank | Median Household Income |
| Immigrants | Saudi Arabia | 75.8 /100 | #152 | Good $86,875 |
| South Americans | 75.1 /100 | #153 | Good $86,824 |
| Immigrants | Germany | 74.4 /100 | #154 | Good $86,764 |
| Carpatho Rusyns | 72.8 /100 | #155 | Good $86,635 |
| Immigrants | Albania | 71.5 /100 | #156 | Good $86,534 |
| Samoans | 71.0 /100 | #157 | Good $86,498 |
| Moroccans | 70.6 /100 | #158 | Good $86,468 |
| Immigrants | Uzbekistan | 70.1 /100 | #159 | Good $86,425 |
| Luxembourgers | 70.0 /100 | #160 | Good $86,418 |
| Slavs | 69.7 /100 | #161 | Good $86,398 |
| Guamanians/Chamorros | 67.7 /100 | #162 | Good $86,255 |
| Czechs | 66.4 /100 | #163 | Good $86,164 |
| Irish | 66.2 /100 | #164 | Good $86,145 |
| Norwegians | 65.3 /100 | #165 | Good $86,084 |
| Scandinavians | 65.1 /100 | #166 | Good $86,073 |
| Immigrants | Immigrants | 61.3 /100 | #167 | Good $85,818 |
| Icelanders | 61.0 /100 | #168 | Good $85,797 |
| Colombians | 59.7 /100 | #169 | Average $85,716 |
| Swiss | 59.2 /100 | #170 | Average $85,681 |
| Immigrants | South America | 58.1 /100 | #171 | Average $85,611 |
| Slovenes | 57.4 /100 | #172 | Average $85,562 |