Creek vs Slovene Median Household Income
COMPARE
Creek
Slovene
Median Household Income
Median Household Income Comparison
Creek
Slovenes
$67,715
MEDIAN HOUSEHOLD INCOME
0.0/ 100
METRIC RATING
333rd/ 347
METRIC RANK
$85,562
MEDIAN HOUSEHOLD INCOME
57.4/ 100
METRIC RATING
172nd/ 347
METRIC RANK
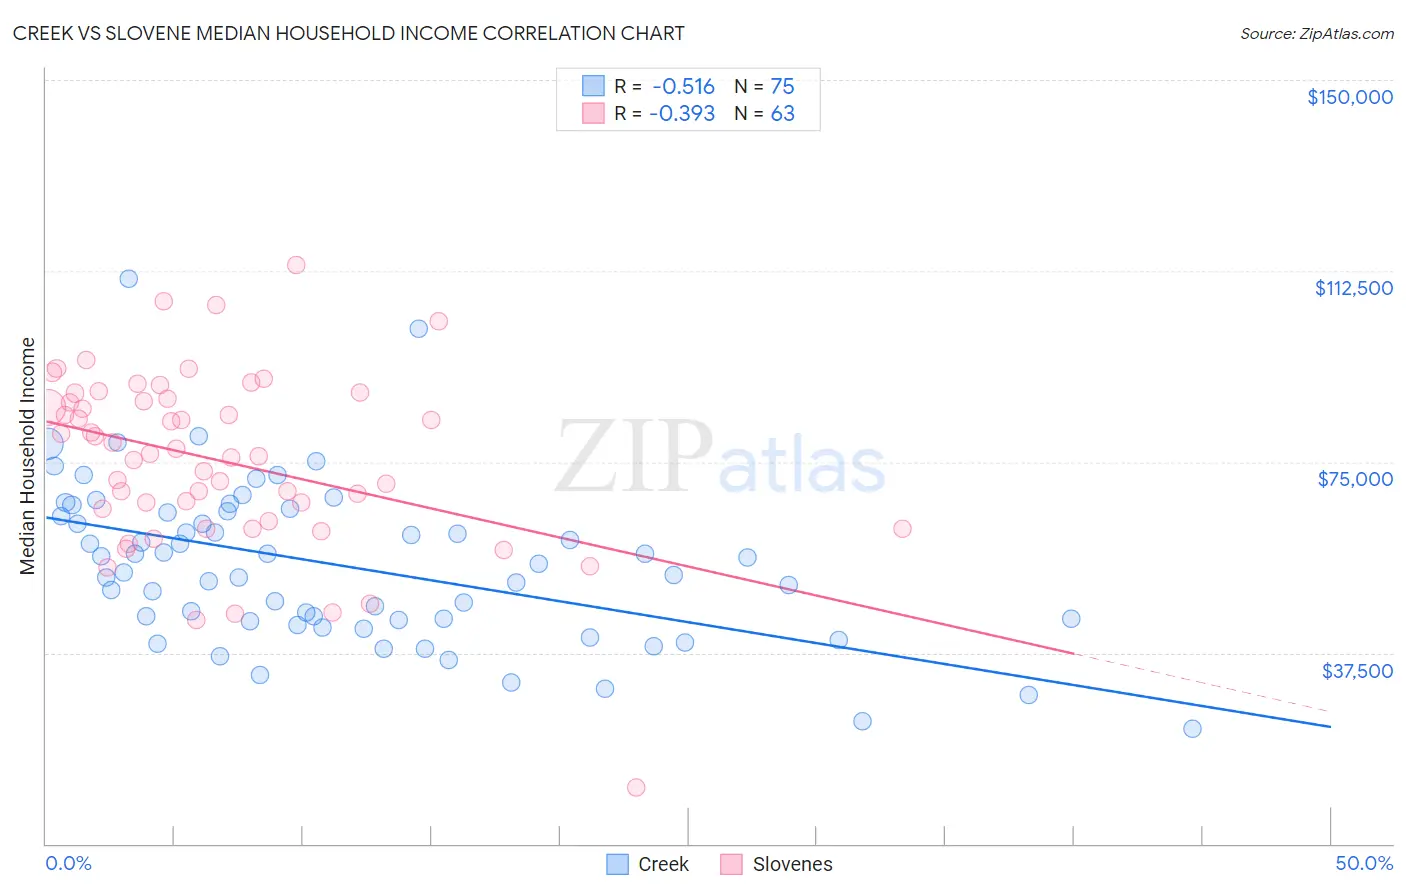
Creek vs Slovene Median Household Income Correlation Chart
The statistical analysis conducted on geographies consisting of 178,405,677 people shows a substantial negative correlation between the proportion of Creek and median household income in the United States with a correlation coefficient (R) of -0.516 and weighted average of $67,715. Similarly, the statistical analysis conducted on geographies consisting of 261,226,883 people shows a mild negative correlation between the proportion of Slovenes and median household income in the United States with a correlation coefficient (R) of -0.393 and weighted average of $85,562, a difference of 26.4%.
Median Household Income Correlation Summary
| Measurement | Creek | Slovene |
| Minimum | $22,500 | $11,161 |
| Maximum | $111,063 | $113,650 |
| Range | $88,563 | $102,489 |
| Mean | $54,543 | $75,280 |
| Median | $53,166 | $76,693 |
| Interquartile 25% (IQ1) | $43,621 | $63,438 |
| Interquartile 75% (IQ3) | $65,130 | $87,449 |
| Interquartile Range (IQR) | $21,509 | $24,011 |
| Standard Deviation (Sample) | $15,915 | $17,550 |
| Standard Deviation (Population) | $15,809 | $17,410 |
Similar Demographics by Median Household Income
Demographics Similar to Creek by Median Household Income
In terms of median household income, the demographic groups most similar to Creek are Sioux ($67,792, a difference of 0.11%), Black/African American ($67,573, a difference of 0.21%), Native/Alaskan ($67,879, a difference of 0.24%), Arapaho ($67,965, a difference of 0.37%), and Dutch West Indian ($68,412, a difference of 1.0%).
| Demographics | Rating | Rank | Median Household Income |
| Yuman | 0.0 /100 | #326 | Tragic $68,743 |
| Immigrants | Cuba | 0.0 /100 | #327 | Tragic $68,461 |
| Menominee | 0.0 /100 | #328 | Tragic $68,423 |
| Dutch West Indians | 0.0 /100 | #329 | Tragic $68,412 |
| Arapaho | 0.0 /100 | #330 | Tragic $67,965 |
| Natives/Alaskans | 0.0 /100 | #331 | Tragic $67,879 |
| Sioux | 0.0 /100 | #332 | Tragic $67,792 |
| Creek | 0.0 /100 | #333 | Tragic $67,715 |
| Blacks/African Americans | 0.0 /100 | #334 | Tragic $67,573 |
| Cheyenne | 0.0 /100 | #335 | Tragic $66,974 |
| Immigrants | Congo | 0.0 /100 | #336 | Tragic $66,768 |
| Kiowa | 0.0 /100 | #337 | Tragic $65,914 |
| Immigrants | Yemen | 0.0 /100 | #338 | Tragic $65,194 |
| Hopi | 0.0 /100 | #339 | Tragic $65,043 |
| Pueblo | 0.0 /100 | #340 | Tragic $64,692 |
Demographics Similar to Slovenes by Median Household Income
In terms of median household income, the demographic groups most similar to Slovenes are Immigrants from South America ($85,611, a difference of 0.060%), Swiss ($85,681, a difference of 0.14%), Colombian ($85,716, a difference of 0.18%), Icelander ($85,797, a difference of 0.27%), and Immigrants from Cameroon ($85,314, a difference of 0.29%).
| Demographics | Rating | Rank | Median Household Income |
| Norwegians | 65.3 /100 | #165 | Good $86,084 |
| Scandinavians | 65.1 /100 | #166 | Good $86,073 |
| Immigrants | Immigrants | 61.3 /100 | #167 | Good $85,818 |
| Icelanders | 61.0 /100 | #168 | Good $85,797 |
| Colombians | 59.7 /100 | #169 | Average $85,716 |
| Swiss | 59.2 /100 | #170 | Average $85,681 |
| Immigrants | South America | 58.1 /100 | #171 | Average $85,611 |
| Slovenes | 57.4 /100 | #172 | Average $85,562 |
| Immigrants | Cameroon | 53.4 /100 | #173 | Average $85,314 |
| Scottish | 50.0 /100 | #174 | Average $85,101 |
| Immigrants | Costa Rica | 49.2 /100 | #175 | Average $85,054 |
| Alsatians | 49.2 /100 | #176 | Average $85,053 |
| Immigrants | Eritrea | 48.8 /100 | #177 | Average $85,025 |
| Czechoslovakians | 47.8 /100 | #178 | Average $84,965 |
| English | 47.0 /100 | #179 | Average $84,915 |