Swedish vs Immigrants from Caribbean Median Female Earnings
COMPARE
Swedish
Immigrants from Caribbean
Median Female Earnings
Median Female Earnings Comparison
Swedes
Immigrants from Caribbean
$39,421
MEDIAN FEMALE EARNINGS
36.0/ 100
METRIC RATING
187th/ 347
METRIC RANK
$36,414
MEDIAN FEMALE EARNINGS
0.1/ 100
METRIC RATING
279th/ 347
METRIC RANK
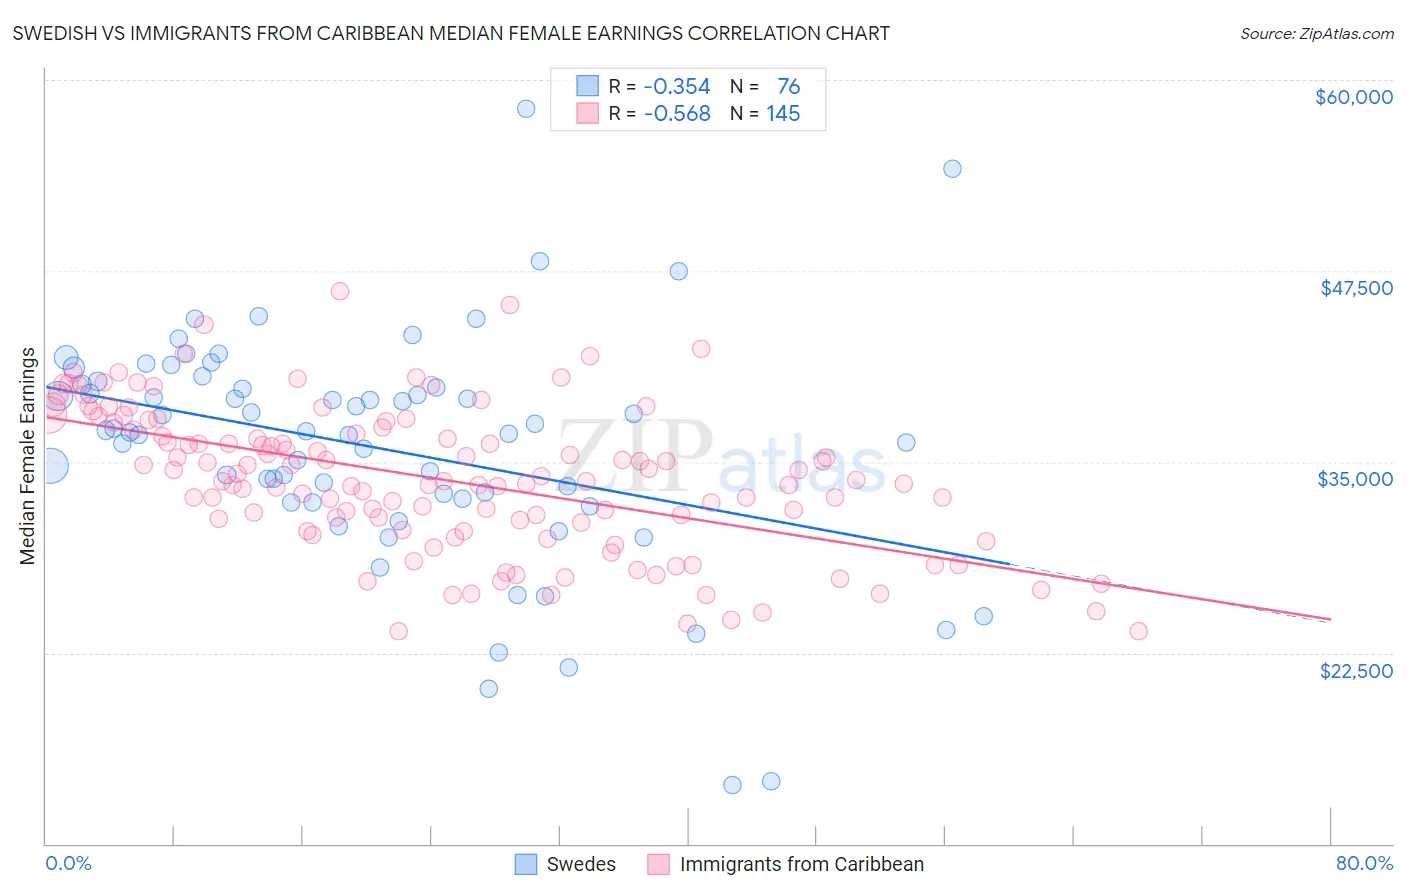
Swedish vs Immigrants from Caribbean Median Female Earnings Correlation Chart
The statistical analysis conducted on geographies consisting of 538,112,894 people shows a mild negative correlation between the proportion of Swedes and median female earnings in the United States with a correlation coefficient (R) of -0.354 and weighted average of $39,421. Similarly, the statistical analysis conducted on geographies consisting of 449,719,186 people shows a substantial negative correlation between the proportion of Immigrants from Caribbean and median female earnings in the United States with a correlation coefficient (R) of -0.568 and weighted average of $36,414, a difference of 8.3%.
Median Female Earnings Correlation Summary
| Measurement | Swedish | Immigrants from Caribbean |
| Minimum | $13,839 | $23,937 |
| Maximum | $58,087 | $46,205 |
| Range | $44,248 | $22,268 |
| Mean | $35,925 | $33,887 |
| Median | $36,993 | $33,768 |
| Interquartile 25% (IQ1) | $32,470 | $30,791 |
| Interquartile 75% (IQ3) | $39,982 | $37,444 |
| Interquartile Range (IQR) | $7,512 | $6,654 |
| Standard Deviation (Sample) | $7,648 | $4,730 |
| Standard Deviation (Population) | $7,597 | $4,714 |
Similar Demographics by Median Female Earnings
Demographics Similar to Swedes by Median Female Earnings
In terms of median female earnings, the demographic groups most similar to Swedes are Bermudan ($39,418, a difference of 0.010%), Immigrants from West Indies ($39,441, a difference of 0.050%), Colombian ($39,439, a difference of 0.050%), European ($39,457, a difference of 0.090%), and Senegalese ($39,384, a difference of 0.090%).
| Demographics | Rating | Rank | Median Female Earnings |
| Immigrants | Kenya | 41.6 /100 | #180 | Average $39,535 |
| Tsimshian | 41.4 /100 | #181 | Average $39,530 |
| Tlingit-Haida | 40.5 /100 | #182 | Average $39,513 |
| Hungarians | 40.3 /100 | #183 | Average $39,510 |
| Europeans | 37.7 /100 | #184 | Fair $39,457 |
| Immigrants | West Indies | 36.9 /100 | #185 | Fair $39,441 |
| Colombians | 36.9 /100 | #186 | Fair $39,439 |
| Swedes | 36.0 /100 | #187 | Fair $39,421 |
| Bermudans | 35.9 /100 | #188 | Fair $39,418 |
| Senegalese | 34.2 /100 | #189 | Fair $39,384 |
| Puget Sound Salish | 33.9 /100 | #190 | Fair $39,376 |
| Immigrants | Western Africa | 32.7 /100 | #191 | Fair $39,351 |
| Immigrants | Immigrants | 31.7 /100 | #192 | Fair $39,328 |
| Immigrants | Nigeria | 30.2 /100 | #193 | Fair $39,294 |
| Irish | 30.0 /100 | #194 | Fair $39,291 |
Demographics Similar to Immigrants from Caribbean by Median Female Earnings
In terms of median female earnings, the demographic groups most similar to Immigrants from Caribbean are Iroquois ($36,408, a difference of 0.020%), U.S. Virgin Islander ($36,424, a difference of 0.030%), Spanish American ($36,391, a difference of 0.060%), Haitian ($36,374, a difference of 0.11%), and Marshallese ($36,459, a difference of 0.12%).
| Demographics | Rating | Rank | Median Female Earnings |
| Immigrants | Dominican Republic | 0.3 /100 | #272 | Tragic $36,857 |
| Immigrants | Laos | 0.3 /100 | #273 | Tragic $36,841 |
| Immigrants | El Salvador | 0.2 /100 | #274 | Tragic $36,673 |
| Africans | 0.1 /100 | #275 | Tragic $36,530 |
| Central Americans | 0.1 /100 | #276 | Tragic $36,492 |
| Marshallese | 0.1 /100 | #277 | Tragic $36,459 |
| U.S. Virgin Islanders | 0.1 /100 | #278 | Tragic $36,424 |
| Immigrants | Caribbean | 0.1 /100 | #279 | Tragic $36,414 |
| Iroquois | 0.1 /100 | #280 | Tragic $36,408 |
| Spanish Americans | 0.1 /100 | #281 | Tragic $36,391 |
| Haitians | 0.1 /100 | #282 | Tragic $36,374 |
| Immigrants | Haiti | 0.1 /100 | #283 | Tragic $36,203 |
| Indonesians | 0.1 /100 | #284 | Tragic $36,140 |
| Paiute | 0.1 /100 | #285 | Tragic $36,056 |
| Osage | 0.0 /100 | #286 | Tragic $36,034 |