Swedish vs Immigrants from Thailand Seniors Poverty Over the Age of 65
COMPARE
Swedish
Immigrants from Thailand
Seniors Poverty Over the Age of 65
Seniors Poverty Over the Age of 65 Comparison
Swedes
Immigrants from Thailand
8.7%
SENIORS POVERTY OVER THE AGE OF 65
100.0/ 100
METRIC RATING
4th/ 347
METRIC RANK
11.0%
SENIORS POVERTY OVER THE AGE OF 65
43.5/ 100
METRIC RATING
180th/ 347
METRIC RANK
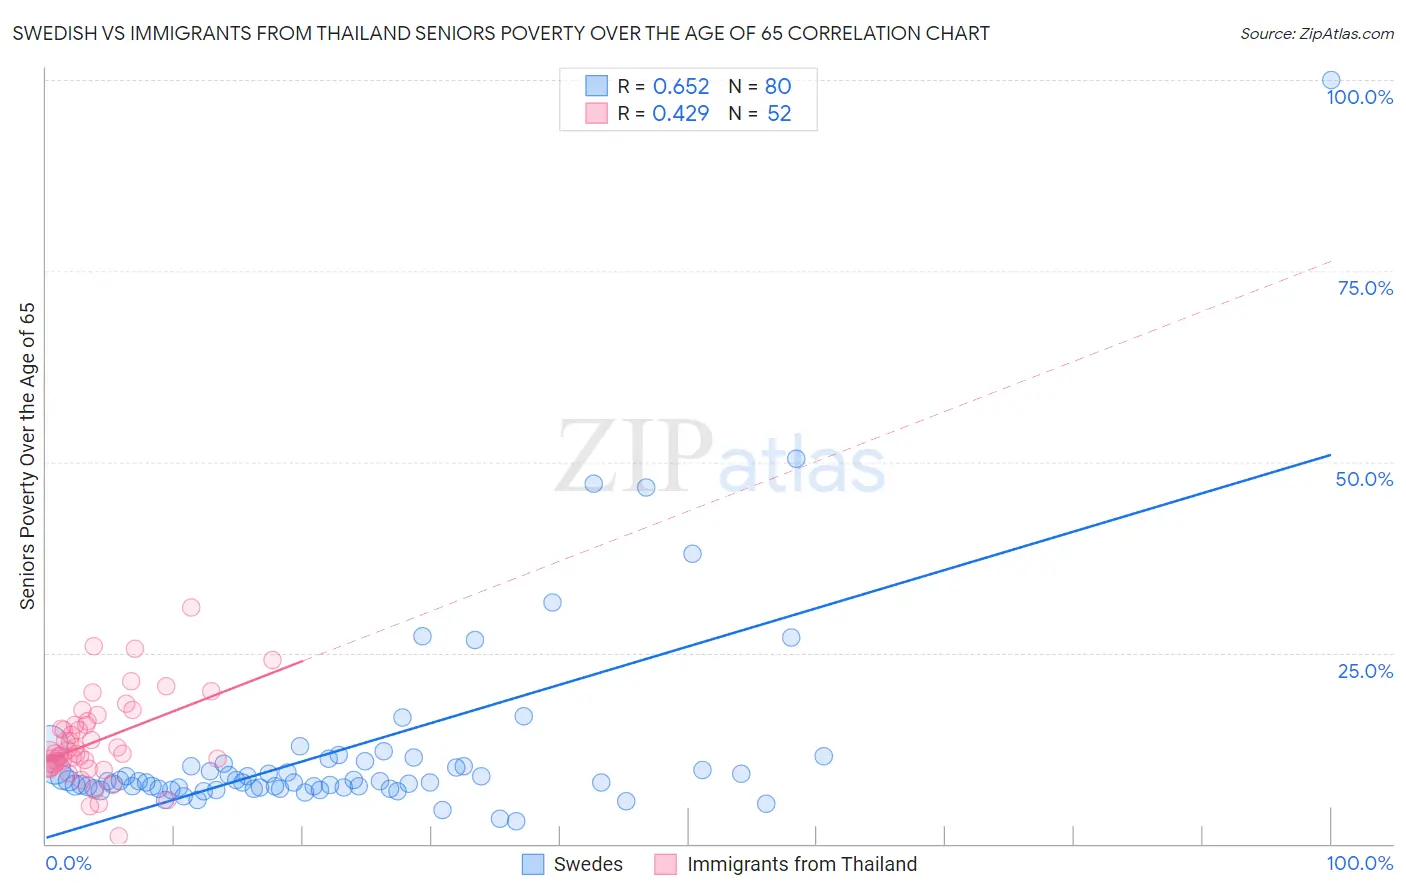
Swedish vs Immigrants from Thailand Seniors Poverty Over the Age of 65 Correlation Chart
The statistical analysis conducted on geographies consisting of 534,843,881 people shows a significant positive correlation between the proportion of Swedes and poverty level among seniors over the age of 65 in the United States with a correlation coefficient (R) of 0.652 and weighted average of 8.7%. Similarly, the statistical analysis conducted on geographies consisting of 316,238,604 people shows a moderate positive correlation between the proportion of Immigrants from Thailand and poverty level among seniors over the age of 65 in the United States with a correlation coefficient (R) of 0.429 and weighted average of 11.0%, a difference of 25.9%.
Seniors Poverty Over the Age of 65 Correlation Summary
| Measurement | Swedish | Immigrants from Thailand |
| Minimum | 2.9% | 0.97% |
| Maximum | 100.0% | 30.9% |
| Range | 97.1% | 29.9% |
| Mean | 12.4% | 13.4% |
| Median | 8.2% | 11.8% |
| Interquartile 25% (IQ1) | 7.3% | 10.5% |
| Interquartile 75% (IQ3) | 10.3% | 15.8% |
| Interquartile Range (IQR) | 3.1% | 5.3% |
| Standard Deviation (Sample) | 13.6% | 5.6% |
| Standard Deviation (Population) | 13.5% | 5.6% |
Similar Demographics by Seniors Poverty Over the Age of 65
Demographics Similar to Swedes by Seniors Poverty Over the Age of 65
In terms of seniors poverty over the age of 65, the demographic groups most similar to Swedes are Immigrants from India (8.8%, a difference of 0.36%), Norwegian (8.7%, a difference of 0.60%), Danish (8.8%, a difference of 0.81%), German (9.0%, a difference of 2.4%), and Czech (9.0%, a difference of 3.0%).
| Demographics | Rating | Rank | Seniors Poverty Over the Age of 65 |
| Chinese | 100.0 /100 | #1 | Exceptional 8.3% |
| Tlingit-Haida | 100.0 /100 | #2 | Exceptional 8.3% |
| Norwegians | 100.0 /100 | #3 | Exceptional 8.7% |
| Swedes | 100.0 /100 | #4 | Exceptional 8.7% |
| Immigrants | India | 100.0 /100 | #5 | Exceptional 8.8% |
| Danes | 100.0 /100 | #6 | Exceptional 8.8% |
| Germans | 100.0 /100 | #7 | Exceptional 9.0% |
| Czechs | 100.0 /100 | #8 | Exceptional 9.0% |
| English | 100.0 /100 | #9 | Exceptional 9.1% |
| Lithuanians | 100.0 /100 | #10 | Exceptional 9.1% |
| Maltese | 99.9 /100 | #11 | Exceptional 9.1% |
| Scandinavians | 99.9 /100 | #12 | Exceptional 9.1% |
| Croatians | 99.9 /100 | #13 | Exceptional 9.1% |
| Poles | 99.9 /100 | #14 | Exceptional 9.1% |
| Dutch | 99.9 /100 | #15 | Exceptional 9.1% |
Demographics Similar to Immigrants from Thailand by Seniors Poverty Over the Age of 65
In terms of seniors poverty over the age of 65, the demographic groups most similar to Immigrants from Thailand are Immigrants from Eastern Africa (11.0%, a difference of 0.0%), Immigrants from Northern Africa (11.0%, a difference of 0.10%), Immigrants from Fiji (11.0%, a difference of 0.13%), Immigrants from Kazakhstan (11.0%, a difference of 0.23%), and Immigrants from France (11.0%, a difference of 0.23%).
| Demographics | Rating | Rank | Seniors Poverty Over the Age of 65 |
| Spaniards | 50.7 /100 | #173 | Average 10.9% |
| Immigrants | Sudan | 50.0 /100 | #174 | Average 10.9% |
| Creek | 49.6 /100 | #175 | Average 10.9% |
| Immigrants | Malaysia | 47.9 /100 | #176 | Average 11.0% |
| Cherokee | 47.3 /100 | #177 | Average 11.0% |
| German Russians | 46.9 /100 | #178 | Average 11.0% |
| Immigrants | Northern Africa | 44.6 /100 | #179 | Average 11.0% |
| Immigrants | Thailand | 43.5 /100 | #180 | Average 11.0% |
| Immigrants | Eastern Africa | 43.4 /100 | #181 | Average 11.0% |
| Immigrants | Fiji | 42.0 /100 | #182 | Average 11.0% |
| Immigrants | Kazakhstan | 41.0 /100 | #183 | Average 11.0% |
| Immigrants | France | 40.9 /100 | #184 | Average 11.0% |
| Immigrants | Lebanon | 38.2 /100 | #185 | Fair 11.1% |
| Immigrants | Eastern Asia | 37.5 /100 | #186 | Fair 11.1% |
| Immigrants | Middle Africa | 37.4 /100 | #187 | Fair 11.1% |