Immigrants from Iran vs Colville Median Male Earnings
COMPARE
Immigrants from Iran
Colville
Median Male Earnings
Median Male Earnings Comparison
Immigrants from Iran
Colville
$69,284
MEDIAN MALE EARNINGS
100.0/ 100
METRIC RATING
8th/ 347
METRIC RANK
$48,516
MEDIAN MALE EARNINGS
0.3/ 100
METRIC RATING
274th/ 347
METRIC RANK
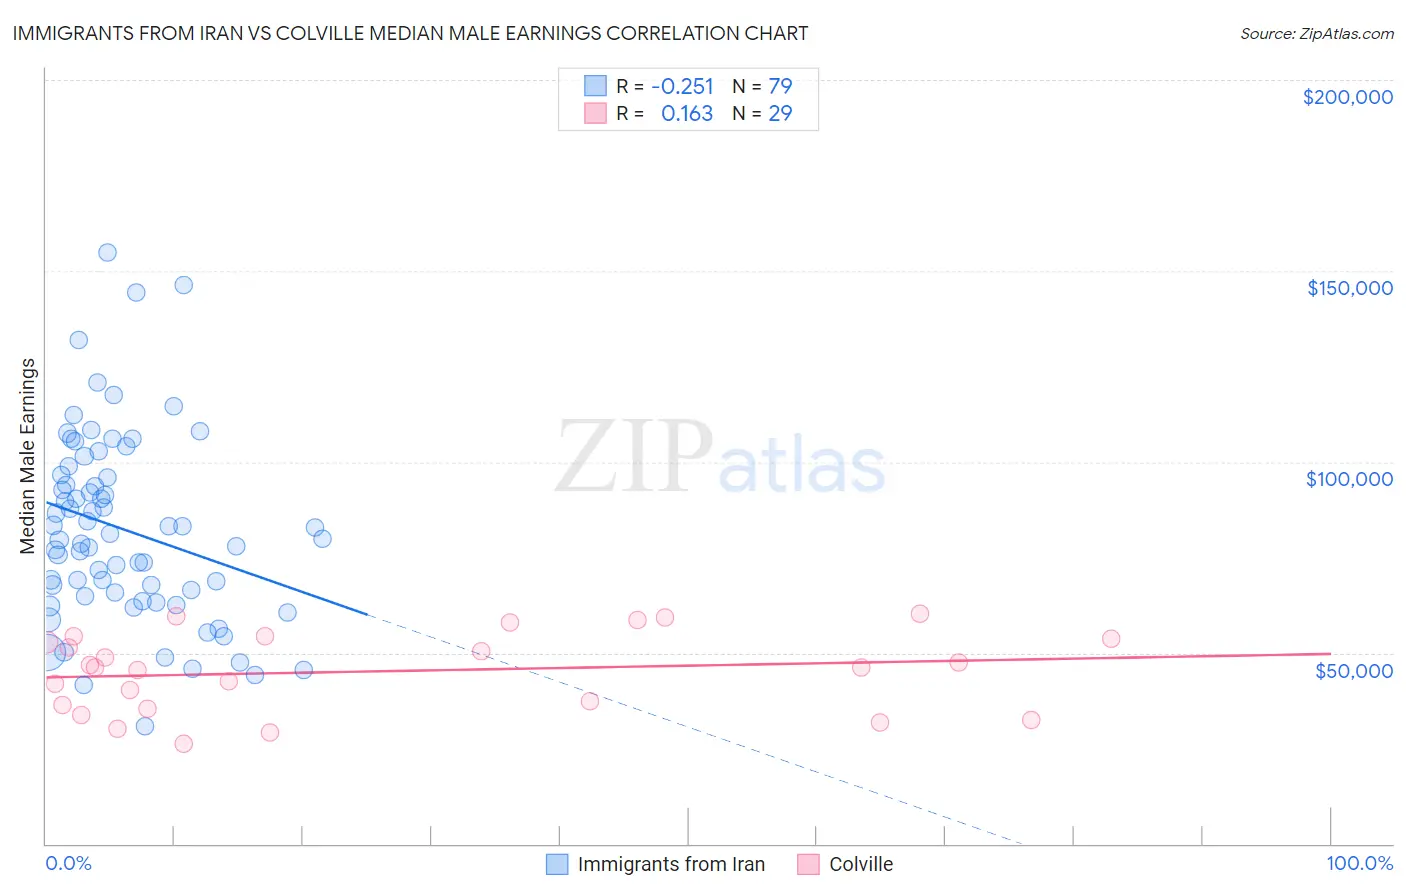
Immigrants from Iran vs Colville Median Male Earnings Correlation Chart
The statistical analysis conducted on geographies consisting of 279,819,877 people shows a weak negative correlation between the proportion of Immigrants from Iran and median male earnings in the United States with a correlation coefficient (R) of -0.251 and weighted average of $69,284. Similarly, the statistical analysis conducted on geographies consisting of 34,680,141 people shows a poor positive correlation between the proportion of Colville and median male earnings in the United States with a correlation coefficient (R) of 0.163 and weighted average of $48,516, a difference of 42.8%.
Median Male Earnings Correlation Summary
| Measurement | Immigrants from Iran | Colville |
| Minimum | $30,816 | $26,071 |
| Maximum | $154,782 | $60,184 |
| Range | $123,966 | $34,113 |
| Mean | $82,249 | $45,174 |
| Median | $79,904 | $46,167 |
| Interquartile 25% (IQ1) | $64,663 | $35,723 |
| Interquartile 75% (IQ3) | $96,638 | $54,047 |
| Interquartile Range (IQR) | $31,975 | $18,325 |
| Standard Deviation (Sample) | $24,742 | $10,311 |
| Standard Deviation (Population) | $24,585 | $10,132 |
Similar Demographics by Median Male Earnings
Demographics Similar to Immigrants from Iran by Median Male Earnings
In terms of median male earnings, the demographic groups most similar to Immigrants from Iran are Immigrants from South Central Asia ($68,960, a difference of 0.47%), Immigrants from Israel ($68,716, a difference of 0.83%), Immigrants from Hong Kong ($70,146, a difference of 1.2%), Iranian ($70,648, a difference of 2.0%), and Immigrants from Ireland ($67,698, a difference of 2.3%).
| Demographics | Rating | Rank | Median Male Earnings |
| Filipinos | 100.0 /100 | #1 | Exceptional $74,224 |
| Immigrants | India | 100.0 /100 | #2 | Exceptional $74,207 |
| Immigrants | Taiwan | 100.0 /100 | #3 | Exceptional $74,031 |
| Thais | 100.0 /100 | #4 | Exceptional $72,135 |
| Immigrants | Singapore | 100.0 /100 | #5 | Exceptional $71,348 |
| Iranians | 100.0 /100 | #6 | Exceptional $70,648 |
| Immigrants | Hong Kong | 100.0 /100 | #7 | Exceptional $70,146 |
| Immigrants | Iran | 100.0 /100 | #8 | Exceptional $69,284 |
| Immigrants | South Central Asia | 100.0 /100 | #9 | Exceptional $68,960 |
| Immigrants | Israel | 100.0 /100 | #10 | Exceptional $68,716 |
| Immigrants | Ireland | 100.0 /100 | #11 | Exceptional $67,698 |
| Immigrants | Australia | 100.0 /100 | #12 | Exceptional $67,634 |
| Immigrants | China | 100.0 /100 | #13 | Exceptional $67,353 |
| Okinawans | 100.0 /100 | #14 | Exceptional $67,232 |
| Immigrants | Eastern Asia | 100.0 /100 | #15 | Exceptional $66,903 |
Demographics Similar to Colville by Median Male Earnings
In terms of median male earnings, the demographic groups most similar to Colville are Immigrants from Somalia ($48,439, a difference of 0.16%), Jamaican ($48,632, a difference of 0.24%), Blackfeet ($48,402, a difference of 0.24%), Salvadoran ($48,646, a difference of 0.27%), and Cherokee ($48,669, a difference of 0.32%).
| Demographics | Rating | Rank | Median Male Earnings |
| Spanish Americans | 0.5 /100 | #267 | Tragic $49,008 |
| Ute | 0.4 /100 | #268 | Tragic $48,899 |
| Tsimshian | 0.4 /100 | #269 | Tragic $48,836 |
| Potawatomi | 0.4 /100 | #270 | Tragic $48,768 |
| Cherokee | 0.3 /100 | #271 | Tragic $48,669 |
| Salvadorans | 0.3 /100 | #272 | Tragic $48,646 |
| Jamaicans | 0.3 /100 | #273 | Tragic $48,632 |
| Colville | 0.3 /100 | #274 | Tragic $48,516 |
| Immigrants | Somalia | 0.3 /100 | #275 | Tragic $48,439 |
| Blackfeet | 0.3 /100 | #276 | Tragic $48,402 |
| Belizeans | 0.2 /100 | #277 | Tragic $48,358 |
| Immigrants | Liberia | 0.2 /100 | #278 | Tragic $48,317 |
| Hmong | 0.2 /100 | #279 | Tragic $48,254 |
| Comanche | 0.2 /100 | #280 | Tragic $48,202 |
| Marshallese | 0.2 /100 | #281 | Tragic $48,137 |