Blackfeet vs Colville Median Male Earnings
COMPARE
Blackfeet
Colville
Median Male Earnings
Median Male Earnings Comparison
Blackfeet
Colville
$48,402
MEDIAN MALE EARNINGS
0.3/ 100
METRIC RATING
276th/ 347
METRIC RANK
$48,516
MEDIAN MALE EARNINGS
0.3/ 100
METRIC RATING
274th/ 347
METRIC RANK
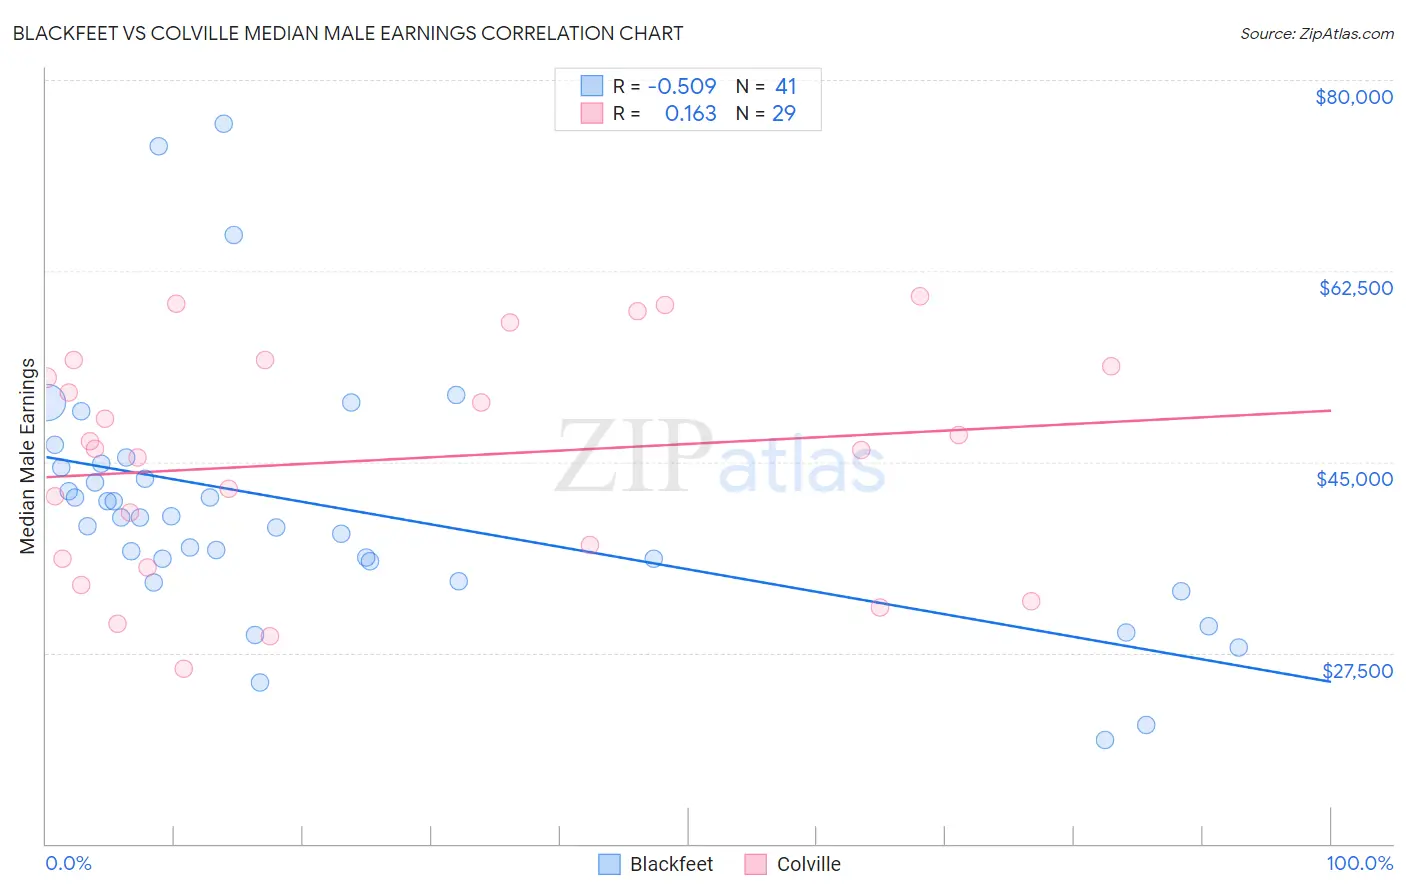
Blackfeet vs Colville Median Male Earnings Correlation Chart
The statistical analysis conducted on geographies consisting of 309,464,268 people shows a substantial negative correlation between the proportion of Blackfeet and median male earnings in the United States with a correlation coefficient (R) of -0.509 and weighted average of $48,402. Similarly, the statistical analysis conducted on geographies consisting of 34,680,141 people shows a poor positive correlation between the proportion of Colville and median male earnings in the United States with a correlation coefficient (R) of 0.163 and weighted average of $48,516, a difference of 0.24%.
Median Male Earnings Correlation Summary
| Measurement | Blackfeet | Colville |
| Minimum | $19,559 | $26,071 |
| Maximum | $76,032 | $60,184 |
| Range | $56,473 | $34,113 |
| Mean | $40,687 | $45,174 |
| Median | $39,915 | $46,167 |
| Interquartile 25% (IQ1) | $35,022 | $35,723 |
| Interquartile 75% (IQ3) | $44,674 | $54,047 |
| Interquartile Range (IQR) | $9,652 | $18,325 |
| Standard Deviation (Sample) | $11,608 | $10,311 |
| Standard Deviation (Population) | $11,465 | $10,132 |
Demographics Similar to Blackfeet and Colville by Median Male Earnings
In terms of median male earnings, the demographic groups most similar to Blackfeet are Immigrants from Somalia ($48,439, a difference of 0.080%), Belizean ($48,358, a difference of 0.090%), Immigrants from Liberia ($48,317, a difference of 0.18%), Hmong ($48,254, a difference of 0.31%), and Comanche ($48,202, a difference of 0.41%). Similarly, the demographic groups most similar to Colville are Immigrants from Somalia ($48,439, a difference of 0.16%), Jamaican ($48,632, a difference of 0.24%), Salvadoran ($48,646, a difference of 0.27%), Cherokee ($48,669, a difference of 0.32%), and Belizean ($48,358, a difference of 0.33%).
| Demographics | Rating | Rank | Median Male Earnings |
| Immigrants | Laos | 0.6 /100 | #265 | Tragic $49,190 |
| Somalis | 0.5 /100 | #266 | Tragic $49,025 |
| Spanish Americans | 0.5 /100 | #267 | Tragic $49,008 |
| Ute | 0.4 /100 | #268 | Tragic $48,899 |
| Tsimshian | 0.4 /100 | #269 | Tragic $48,836 |
| Potawatomi | 0.4 /100 | #270 | Tragic $48,768 |
| Cherokee | 0.3 /100 | #271 | Tragic $48,669 |
| Salvadorans | 0.3 /100 | #272 | Tragic $48,646 |
| Jamaicans | 0.3 /100 | #273 | Tragic $48,632 |
| Colville | 0.3 /100 | #274 | Tragic $48,516 |
| Immigrants | Somalia | 0.3 /100 | #275 | Tragic $48,439 |
| Blackfeet | 0.3 /100 | #276 | Tragic $48,402 |
| Belizeans | 0.2 /100 | #277 | Tragic $48,358 |
| Immigrants | Liberia | 0.2 /100 | #278 | Tragic $48,317 |
| Hmong | 0.2 /100 | #279 | Tragic $48,254 |
| Comanche | 0.2 /100 | #280 | Tragic $48,202 |
| Marshallese | 0.2 /100 | #281 | Tragic $48,137 |
| Central Americans | 0.2 /100 | #282 | Tragic $48,093 |
| Immigrants | Jamaica | 0.2 /100 | #283 | Tragic $48,040 |
| Africans | 0.2 /100 | #284 | Tragic $47,994 |
| Paiute | 0.2 /100 | #285 | Tragic $47,991 |