Sudanese vs Immigrants from Lithuania Female Disability
COMPARE
Sudanese
Immigrants from Lithuania
Female Disability
Female Disability Comparison
Sudanese
Immigrants from Lithuania
12.0%
FEMALE DISABILITY
79.1/ 100
METRIC RATING
153rd/ 347
METRIC RANK
11.2%
FEMALE DISABILITY
100.0/ 100
METRIC RATING
39th/ 347
METRIC RANK
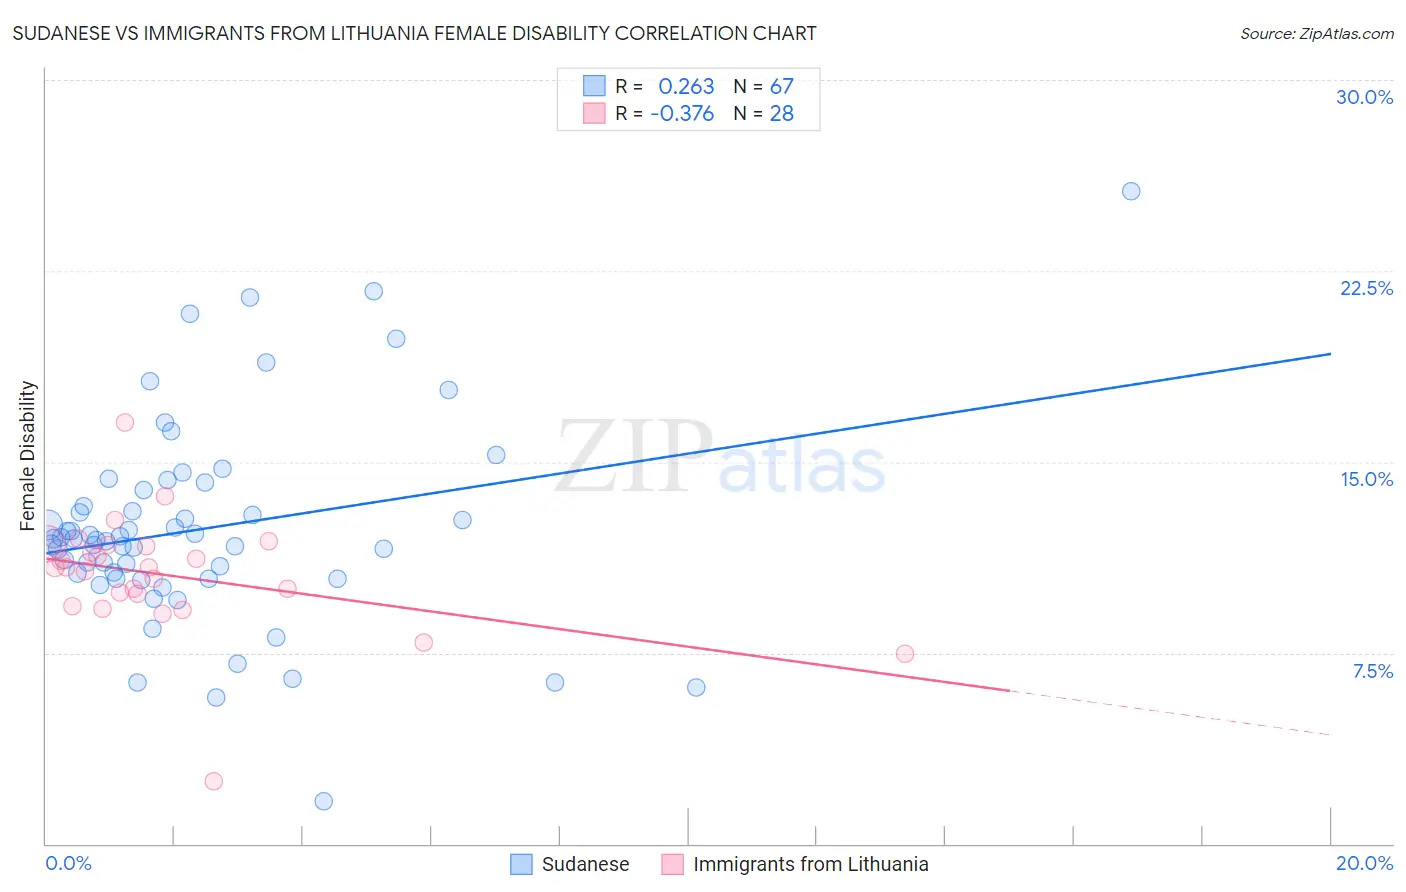
Sudanese vs Immigrants from Lithuania Female Disability Correlation Chart
The statistical analysis conducted on geographies consisting of 110,131,007 people shows a weak positive correlation between the proportion of Sudanese and percentage of females with a disability in the United States with a correlation coefficient (R) of 0.263 and weighted average of 12.0%. Similarly, the statistical analysis conducted on geographies consisting of 117,714,022 people shows a mild negative correlation between the proportion of Immigrants from Lithuania and percentage of females with a disability in the United States with a correlation coefficient (R) of -0.376 and weighted average of 11.2%, a difference of 7.3%.
Female Disability Correlation Summary
| Measurement | Sudanese | Immigrants from Lithuania |
| Minimum | 1.7% | 2.4% |
| Maximum | 25.6% | 16.5% |
| Range | 23.9% | 14.1% |
| Mean | 12.4% | 10.5% |
| Median | 12.0% | 10.8% |
| Interquartile 25% (IQ1) | 10.4% | 9.6% |
| Interquartile 75% (IQ3) | 13.9% | 11.7% |
| Interquartile Range (IQR) | 3.5% | 2.1% |
| Standard Deviation (Sample) | 4.0% | 2.4% |
| Standard Deviation (Population) | 4.0% | 2.3% |
Similar Demographics by Female Disability
Demographics Similar to Sudanese by Female Disability
In terms of female disability, the demographic groups most similar to Sudanese are Immigrants from Scotland (12.0%, a difference of 0.010%), Icelander (12.0%, a difference of 0.090%), Syrian (12.1%, a difference of 0.13%), Immigrants from Moldova (12.0%, a difference of 0.14%), and Ghanaian (12.1%, a difference of 0.14%).
| Demographics | Rating | Rank | Female Disability |
| Pakistanis | 84.6 /100 | #146 | Excellent 12.0% |
| Nigerians | 84.0 /100 | #147 | Excellent 12.0% |
| Immigrants | Kenya | 83.1 /100 | #148 | Excellent 12.0% |
| Greeks | 82.0 /100 | #149 | Excellent 12.0% |
| Immigrants | Moldova | 81.4 /100 | #150 | Excellent 12.0% |
| Icelanders | 80.7 /100 | #151 | Excellent 12.0% |
| Immigrants | Scotland | 79.3 /100 | #152 | Good 12.0% |
| Sudanese | 79.1 /100 | #153 | Good 12.0% |
| Syrians | 76.9 /100 | #154 | Good 12.1% |
| Ghanaians | 76.6 /100 | #155 | Good 12.1% |
| Moroccans | 72.9 /100 | #156 | Good 12.1% |
| Danes | 72.5 /100 | #157 | Good 12.1% |
| Immigrants | Middle Africa | 72.4 /100 | #158 | Good 12.1% |
| Immigrants | Central America | 67.7 /100 | #159 | Good 12.1% |
| Immigrants | Guatemala | 66.0 /100 | #160 | Good 12.1% |
Demographics Similar to Immigrants from Lithuania by Female Disability
In terms of female disability, the demographic groups most similar to Immigrants from Lithuania are Mongolian (11.2%, a difference of 0.030%), Paraguayan (11.2%, a difference of 0.050%), Israeli (11.2%, a difference of 0.15%), Afghan (11.2%, a difference of 0.17%), and Immigrants from Ethiopia (11.2%, a difference of 0.21%).
| Demographics | Rating | Rank | Female Disability |
| Immigrants | Australia | 100.0 /100 | #32 | Exceptional 11.1% |
| Immigrants | Egypt | 100.0 /100 | #33 | Exceptional 11.1% |
| Immigrants | Indonesia | 100.0 /100 | #34 | Exceptional 11.2% |
| Immigrants | Japan | 100.0 /100 | #35 | Exceptional 11.2% |
| Cypriots | 100.0 /100 | #36 | Exceptional 11.2% |
| Ethiopians | 100.0 /100 | #37 | Exceptional 11.2% |
| Immigrants | Ethiopia | 100.0 /100 | #38 | Exceptional 11.2% |
| Immigrants | Lithuania | 100.0 /100 | #39 | Exceptional 11.2% |
| Mongolians | 100.0 /100 | #40 | Exceptional 11.2% |
| Paraguayans | 100.0 /100 | #41 | Exceptional 11.2% |
| Israelis | 100.0 /100 | #42 | Exceptional 11.2% |
| Afghans | 100.0 /100 | #43 | Exceptional 11.2% |
| Cambodians | 100.0 /100 | #44 | Exceptional 11.3% |
| Immigrants | Sweden | 100.0 /100 | #45 | Exceptional 11.3% |
| Immigrants | Nepal | 100.0 /100 | #46 | Exceptional 11.3% |