Sudanese vs English Median Female Earnings
COMPARE
Sudanese
English
Median Female Earnings
Median Female Earnings Comparison
Sudanese
English
$38,215
MEDIAN FEMALE EARNINGS
4.4/ 100
METRIC RATING
235th/ 347
METRIC RANK
$38,196
MEDIAN FEMALE EARNINGS
4.2/ 100
METRIC RATING
239th/ 347
METRIC RANK
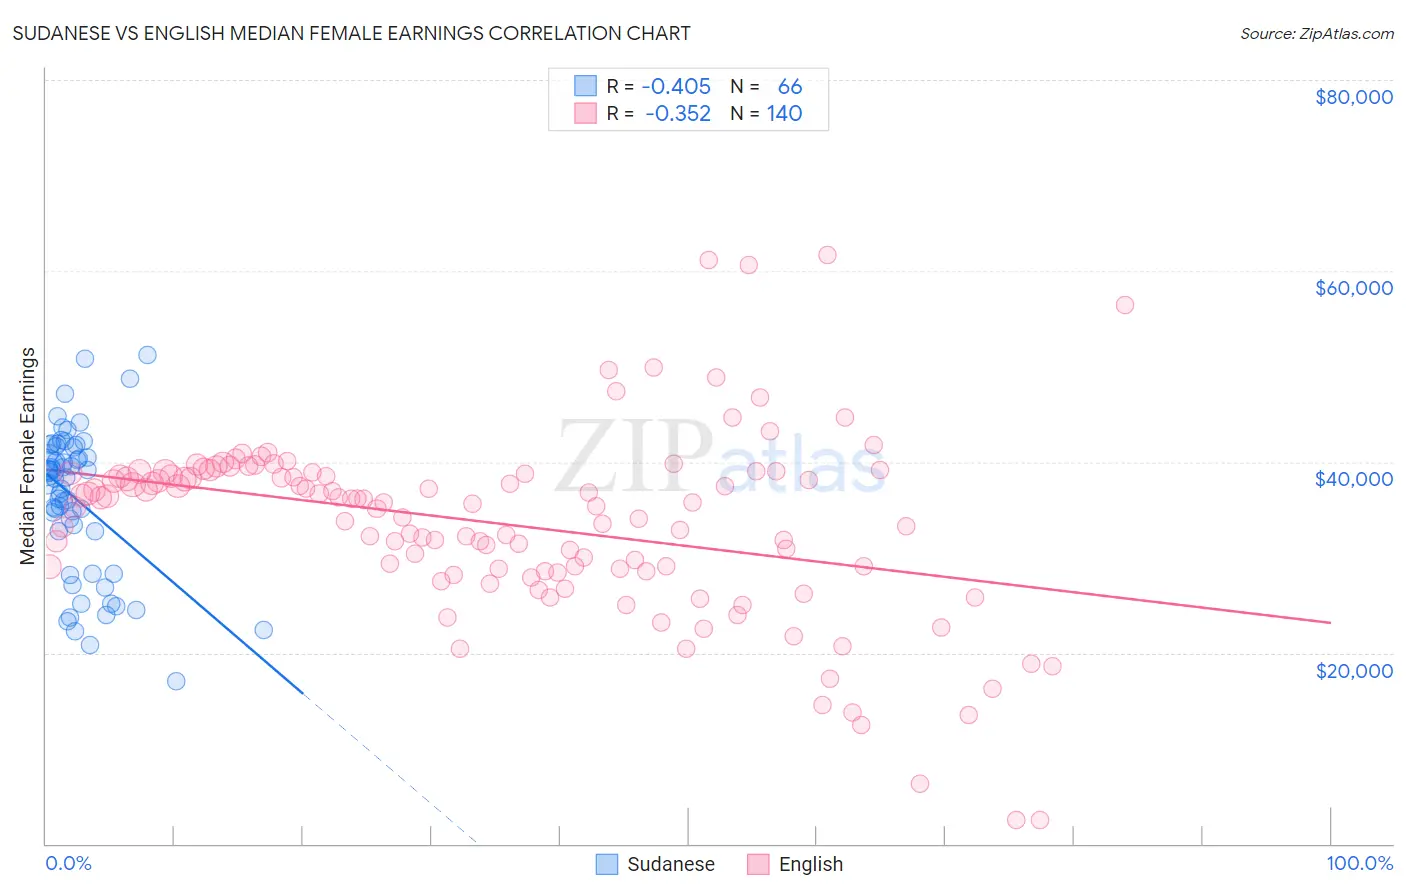
Sudanese vs English Median Female Earnings Correlation Chart
The statistical analysis conducted on geographies consisting of 110,138,863 people shows a moderate negative correlation between the proportion of Sudanese and median female earnings in the United States with a correlation coefficient (R) of -0.405 and weighted average of $38,215. Similarly, the statistical analysis conducted on geographies consisting of 577,154,042 people shows a mild negative correlation between the proportion of English and median female earnings in the United States with a correlation coefficient (R) of -0.352 and weighted average of $38,196, a difference of 0.050%.
Median Female Earnings Correlation Summary
| Measurement | Sudanese | English |
| Minimum | $17,051 | $2,499 |
| Maximum | $51,172 | $61,721 |
| Range | $34,121 | $59,222 |
| Mean | $36,010 | $33,482 |
| Median | $38,359 | $35,643 |
| Interquartile 25% (IQ1) | $32,734 | $28,708 |
| Interquartile 75% (IQ3) | $41,525 | $38,774 |
| Interquartile Range (IQR) | $8,791 | $10,066 |
| Standard Deviation (Sample) | $7,666 | $9,710 |
| Standard Deviation (Population) | $7,607 | $9,675 |
Demographics Similar to Sudanese and English by Median Female Earnings
In terms of median female earnings, the demographic groups most similar to Sudanese are Liberian ($38,215, a difference of 0.0%), Immigrants from Cabo Verde ($38,208, a difference of 0.020%), Alaska Native ($38,202, a difference of 0.040%), Finnish ($38,173, a difference of 0.11%), and Celtic ($38,283, a difference of 0.18%). Similarly, the demographic groups most similar to English are Alaska Native ($38,202, a difference of 0.020%), Immigrants from Cabo Verde ($38,208, a difference of 0.030%), Liberian ($38,215, a difference of 0.050%), Finnish ($38,173, a difference of 0.060%), and Celtic ($38,283, a difference of 0.23%).
| Demographics | Rating | Rank | Median Female Earnings |
| Scottish | 6.3 /100 | #227 | Tragic $38,397 |
| Sub-Saharan Africans | 6.2 /100 | #228 | Tragic $38,391 |
| Belgians | 6.1 /100 | #229 | Tragic $38,382 |
| Basques | 5.7 /100 | #230 | Tragic $38,352 |
| Somalis | 5.5 /100 | #231 | Tragic $38,333 |
| Scandinavians | 5.2 /100 | #232 | Tragic $38,306 |
| Tongans | 5.1 /100 | #233 | Tragic $38,288 |
| Celtics | 5.0 /100 | #234 | Tragic $38,283 |
| Sudanese | 4.4 /100 | #235 | Tragic $38,215 |
| Liberians | 4.4 /100 | #236 | Tragic $38,215 |
| Immigrants | Cabo Verde | 4.3 /100 | #237 | Tragic $38,208 |
| Alaska Natives | 4.3 /100 | #238 | Tragic $38,202 |
| English | 4.2 /100 | #239 | Tragic $38,196 |
| Finns | 4.0 /100 | #240 | Tragic $38,173 |
| Spanish | 3.5 /100 | #241 | Tragic $38,098 |
| Immigrants | Burma/Myanmar | 3.0 /100 | #242 | Tragic $38,028 |
| Germans | 2.8 /100 | #243 | Tragic $37,986 |
| Immigrants | Liberia | 2.7 /100 | #244 | Tragic $37,970 |
| Immigrants | Middle Africa | 2.7 /100 | #245 | Tragic $37,965 |
| Delaware | 2.6 /100 | #246 | Tragic $37,964 |
| Immigrants | Somalia | 2.4 /100 | #247 | Tragic $37,914 |