Sudanese vs Croatian Median Female Earnings
COMPARE
Sudanese
Croatian
Median Female Earnings
Median Female Earnings Comparison
Sudanese
Croatians
$38,215
MEDIAN FEMALE EARNINGS
4.4/ 100
METRIC RATING
235th/ 347
METRIC RANK
$40,993
MEDIAN FEMALE EARNINGS
93.7/ 100
METRIC RATING
121st/ 347
METRIC RANK
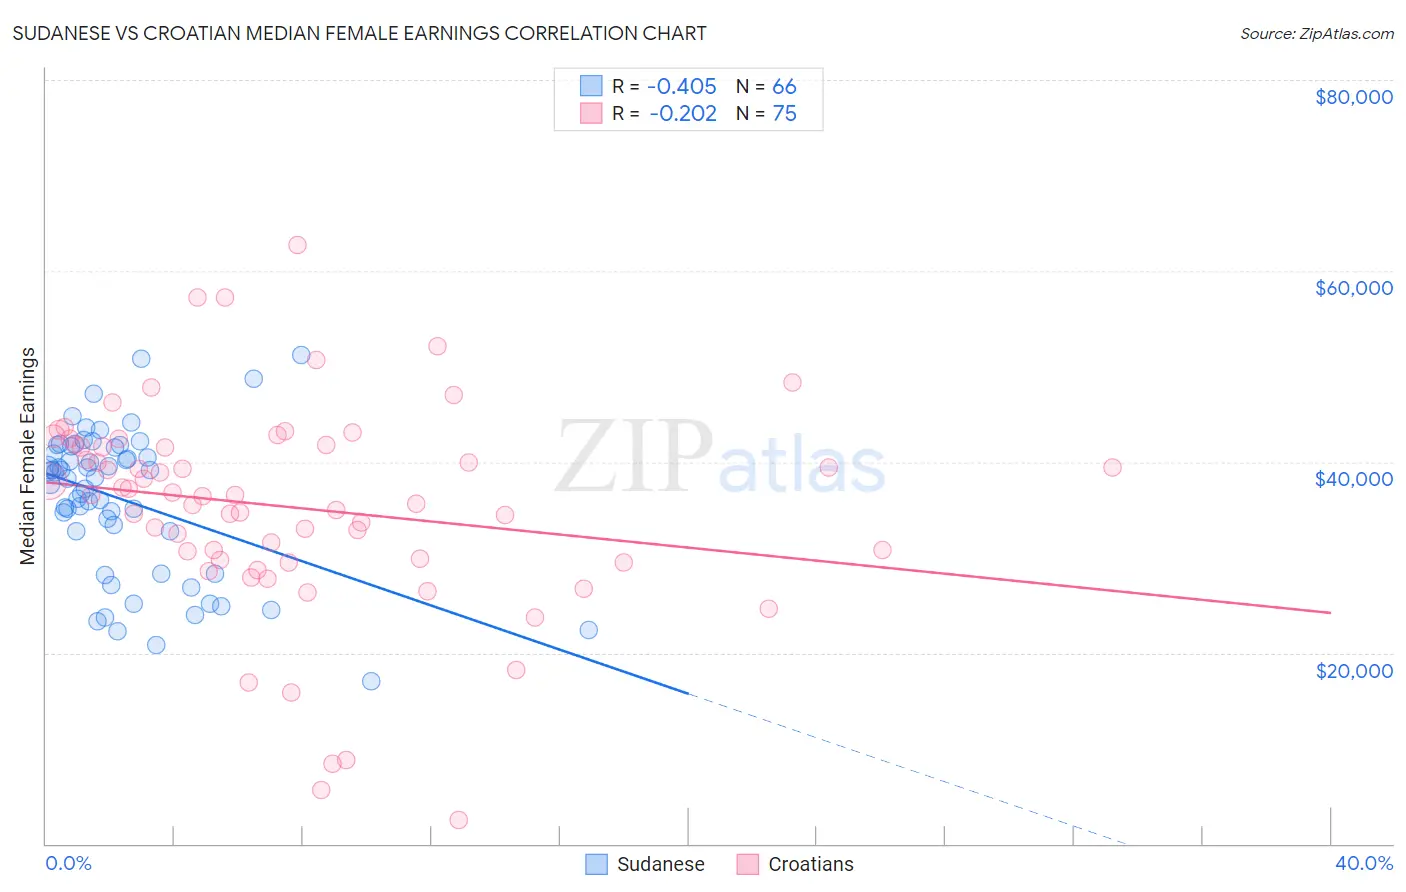
Sudanese vs Croatian Median Female Earnings Correlation Chart
The statistical analysis conducted on geographies consisting of 110,138,863 people shows a moderate negative correlation between the proportion of Sudanese and median female earnings in the United States with a correlation coefficient (R) of -0.405 and weighted average of $38,215. Similarly, the statistical analysis conducted on geographies consisting of 375,526,818 people shows a weak negative correlation between the proportion of Croatians and median female earnings in the United States with a correlation coefficient (R) of -0.202 and weighted average of $40,993, a difference of 7.3%.
Median Female Earnings Correlation Summary
| Measurement | Sudanese | Croatian |
| Minimum | $17,051 | $2,499 |
| Maximum | $51,172 | $62,750 |
| Range | $34,121 | $60,251 |
| Mean | $36,010 | $35,223 |
| Median | $38,359 | $36,468 |
| Interquartile 25% (IQ1) | $32,734 | $29,748 |
| Interquartile 75% (IQ3) | $41,525 | $41,743 |
| Interquartile Range (IQR) | $8,791 | $11,995 |
| Standard Deviation (Sample) | $7,666 | $11,020 |
| Standard Deviation (Population) | $7,607 | $10,947 |
Similar Demographics by Median Female Earnings
Demographics Similar to Sudanese by Median Female Earnings
In terms of median female earnings, the demographic groups most similar to Sudanese are Liberian ($38,215, a difference of 0.0%), Immigrants from Cabo Verde ($38,208, a difference of 0.020%), Alaska Native ($38,202, a difference of 0.040%), English ($38,196, a difference of 0.050%), and Finnish ($38,173, a difference of 0.11%).
| Demographics | Rating | Rank | Median Female Earnings |
| Sub-Saharan Africans | 6.2 /100 | #228 | Tragic $38,391 |
| Belgians | 6.1 /100 | #229 | Tragic $38,382 |
| Basques | 5.7 /100 | #230 | Tragic $38,352 |
| Somalis | 5.5 /100 | #231 | Tragic $38,333 |
| Scandinavians | 5.2 /100 | #232 | Tragic $38,306 |
| Tongans | 5.1 /100 | #233 | Tragic $38,288 |
| Celtics | 5.0 /100 | #234 | Tragic $38,283 |
| Sudanese | 4.4 /100 | #235 | Tragic $38,215 |
| Liberians | 4.4 /100 | #236 | Tragic $38,215 |
| Immigrants | Cabo Verde | 4.3 /100 | #237 | Tragic $38,208 |
| Alaska Natives | 4.3 /100 | #238 | Tragic $38,202 |
| English | 4.2 /100 | #239 | Tragic $38,196 |
| Finns | 4.0 /100 | #240 | Tragic $38,173 |
| Spanish | 3.5 /100 | #241 | Tragic $38,098 |
| Immigrants | Burma/Myanmar | 3.0 /100 | #242 | Tragic $38,028 |
Demographics Similar to Croatians by Median Female Earnings
In terms of median female earnings, the demographic groups most similar to Croatians are Immigrants from Jordan ($40,977, a difference of 0.040%), Guyanese ($40,973, a difference of 0.050%), Trinidadian and Tobagonian ($40,958, a difference of 0.090%), Immigrants from Kuwait ($41,055, a difference of 0.15%), and Austrian ($40,923, a difference of 0.17%).
| Demographics | Rating | Rank | Median Female Earnings |
| Immigrants | England | 96.4 /100 | #114 | Exceptional $41,277 |
| Koreans | 96.4 /100 | #115 | Exceptional $41,276 |
| Immigrants | Brazil | 96.4 /100 | #116 | Exceptional $41,273 |
| Barbadians | 96.3 /100 | #117 | Exceptional $41,261 |
| Immigrants | Lebanon | 95.6 /100 | #118 | Exceptional $41,183 |
| Immigrants | Philippines | 95.0 /100 | #119 | Exceptional $41,114 |
| Immigrants | Kuwait | 94.4 /100 | #120 | Exceptional $41,055 |
| Croatians | 93.7 /100 | #121 | Exceptional $40,993 |
| Immigrants | Jordan | 93.5 /100 | #122 | Exceptional $40,977 |
| Guyanese | 93.4 /100 | #123 | Exceptional $40,973 |
| Trinidadians and Tobagonians | 93.2 /100 | #124 | Exceptional $40,958 |
| Austrians | 92.7 /100 | #125 | Exceptional $40,923 |
| Immigrants | Trinidad and Tobago | 92.3 /100 | #126 | Exceptional $40,895 |
| Ugandans | 92.2 /100 | #127 | Exceptional $40,889 |
| Carpatho Rusyns | 91.2 /100 | #128 | Exceptional $40,825 |