Immigrants from Sri Lanka vs English Median Female Earnings
COMPARE
Immigrants from Sri Lanka
English
Median Female Earnings
Median Female Earnings Comparison
Immigrants from Sri Lanka
English
$44,161
MEDIAN FEMALE EARNINGS
100.0/ 100
METRIC RATING
35th/ 347
METRIC RANK
$38,196
MEDIAN FEMALE EARNINGS
4.2/ 100
METRIC RATING
239th/ 347
METRIC RANK
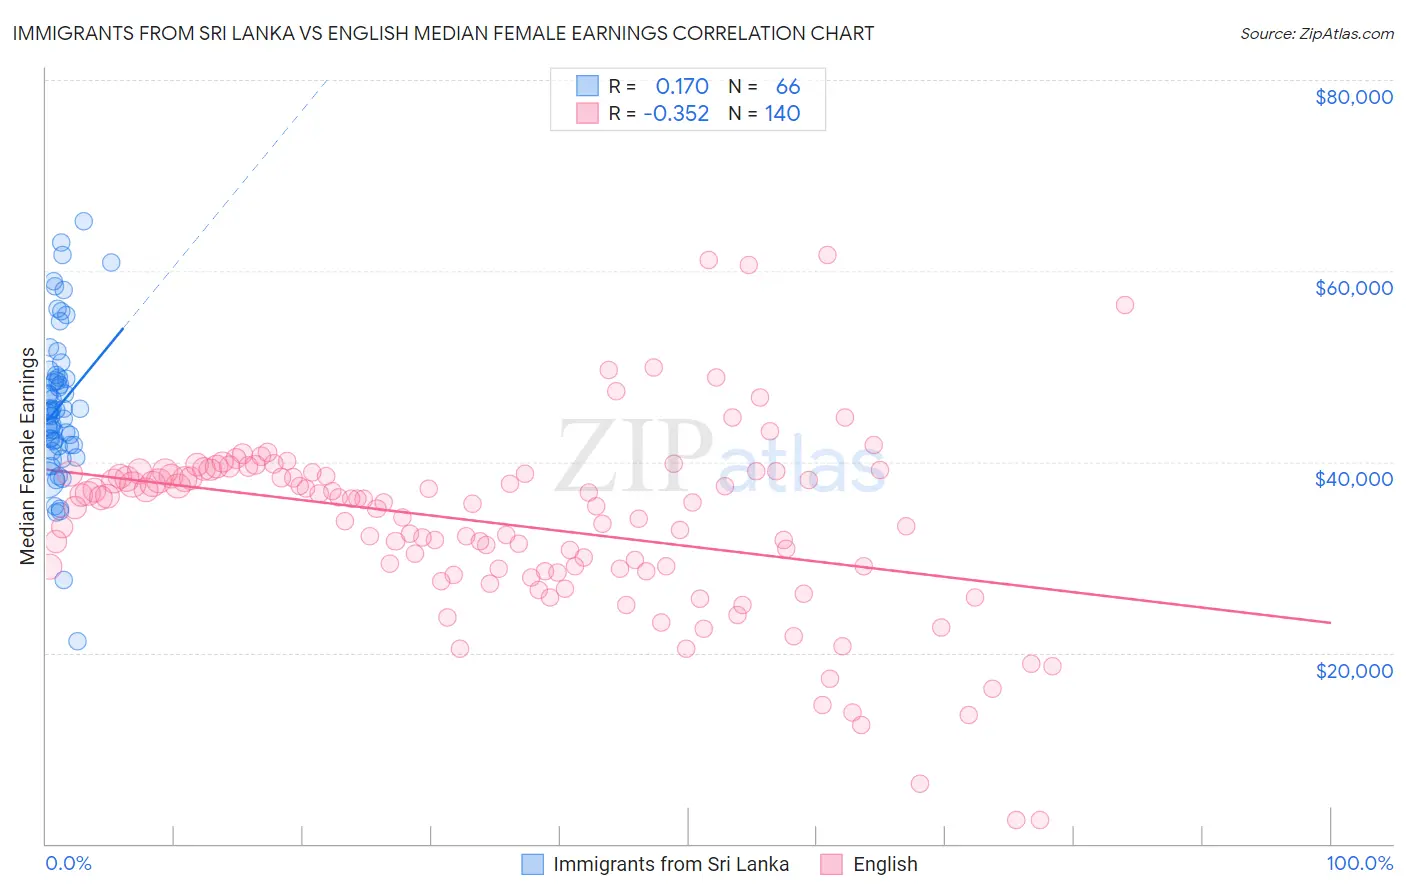
Immigrants from Sri Lanka vs English Median Female Earnings Correlation Chart
The statistical analysis conducted on geographies consisting of 149,683,911 people shows a poor positive correlation between the proportion of Immigrants from Sri Lanka and median female earnings in the United States with a correlation coefficient (R) of 0.170 and weighted average of $44,161. Similarly, the statistical analysis conducted on geographies consisting of 577,154,042 people shows a mild negative correlation between the proportion of English and median female earnings in the United States with a correlation coefficient (R) of -0.352 and weighted average of $38,196, a difference of 15.6%.
Median Female Earnings Correlation Summary
| Measurement | Immigrants from Sri Lanka | English |
| Minimum | $21,250 | $2,499 |
| Maximum | $65,169 | $61,721 |
| Range | $43,919 | $59,222 |
| Mean | $45,787 | $33,482 |
| Median | $45,387 | $35,643 |
| Interquartile 25% (IQ1) | $41,731 | $28,708 |
| Interquartile 75% (IQ3) | $48,786 | $38,774 |
| Interquartile Range (IQR) | $7,055 | $10,066 |
| Standard Deviation (Sample) | $7,939 | $9,710 |
| Standard Deviation (Population) | $7,878 | $9,675 |
Similar Demographics by Median Female Earnings
Demographics Similar to Immigrants from Sri Lanka by Median Female Earnings
In terms of median female earnings, the demographic groups most similar to Immigrants from Sri Lanka are Russian ($44,169, a difference of 0.020%), Immigrants from Asia ($44,198, a difference of 0.080%), Immigrants from Turkey ($44,066, a difference of 0.21%), Immigrants from Switzerland ($43,996, a difference of 0.37%), and Immigrants from Northern Europe ($44,366, a difference of 0.46%).
| Demographics | Rating | Rank | Median Female Earnings |
| Immigrants | Russia | 100.0 /100 | #28 | Exceptional $44,680 |
| Immigrants | Belgium | 100.0 /100 | #29 | Exceptional $44,587 |
| Asians | 100.0 /100 | #30 | Exceptional $44,586 |
| Immigrants | France | 100.0 /100 | #31 | Exceptional $44,541 |
| Immigrants | Northern Europe | 100.0 /100 | #32 | Exceptional $44,366 |
| Immigrants | Asia | 100.0 /100 | #33 | Exceptional $44,198 |
| Russians | 100.0 /100 | #34 | Exceptional $44,169 |
| Immigrants | Sri Lanka | 100.0 /100 | #35 | Exceptional $44,161 |
| Immigrants | Turkey | 100.0 /100 | #36 | Exceptional $44,066 |
| Immigrants | Switzerland | 100.0 /100 | #37 | Exceptional $43,996 |
| Latvians | 100.0 /100 | #38 | Exceptional $43,941 |
| Israelis | 100.0 /100 | #39 | Exceptional $43,852 |
| Immigrants | Malaysia | 100.0 /100 | #40 | Exceptional $43,835 |
| Bhutanese | 100.0 /100 | #41 | Exceptional $43,648 |
| Immigrants | Denmark | 100.0 /100 | #42 | Exceptional $43,646 |
Demographics Similar to English by Median Female Earnings
In terms of median female earnings, the demographic groups most similar to English are Alaska Native ($38,202, a difference of 0.020%), Immigrants from Cabo Verde ($38,208, a difference of 0.030%), Sudanese ($38,215, a difference of 0.050%), Liberian ($38,215, a difference of 0.050%), and Finnish ($38,173, a difference of 0.060%).
| Demographics | Rating | Rank | Median Female Earnings |
| Scandinavians | 5.2 /100 | #232 | Tragic $38,306 |
| Tongans | 5.1 /100 | #233 | Tragic $38,288 |
| Celtics | 5.0 /100 | #234 | Tragic $38,283 |
| Sudanese | 4.4 /100 | #235 | Tragic $38,215 |
| Liberians | 4.4 /100 | #236 | Tragic $38,215 |
| Immigrants | Cabo Verde | 4.3 /100 | #237 | Tragic $38,208 |
| Alaska Natives | 4.3 /100 | #238 | Tragic $38,202 |
| English | 4.2 /100 | #239 | Tragic $38,196 |
| Finns | 4.0 /100 | #240 | Tragic $38,173 |
| Spanish | 3.5 /100 | #241 | Tragic $38,098 |
| Immigrants | Burma/Myanmar | 3.0 /100 | #242 | Tragic $38,028 |
| Germans | 2.8 /100 | #243 | Tragic $37,986 |
| Immigrants | Liberia | 2.7 /100 | #244 | Tragic $37,970 |
| Immigrants | Middle Africa | 2.7 /100 | #245 | Tragic $37,965 |
| Delaware | 2.6 /100 | #246 | Tragic $37,964 |