Immigrants from Yemen vs English Median Female Earnings
COMPARE
Immigrants from Yemen
English
Median Female Earnings
Median Female Earnings Comparison
Immigrants from Yemen
English
$34,693
MEDIAN FEMALE EARNINGS
0.0/ 100
METRIC RATING
318th/ 347
METRIC RANK
$38,196
MEDIAN FEMALE EARNINGS
4.2/ 100
METRIC RATING
239th/ 347
METRIC RANK
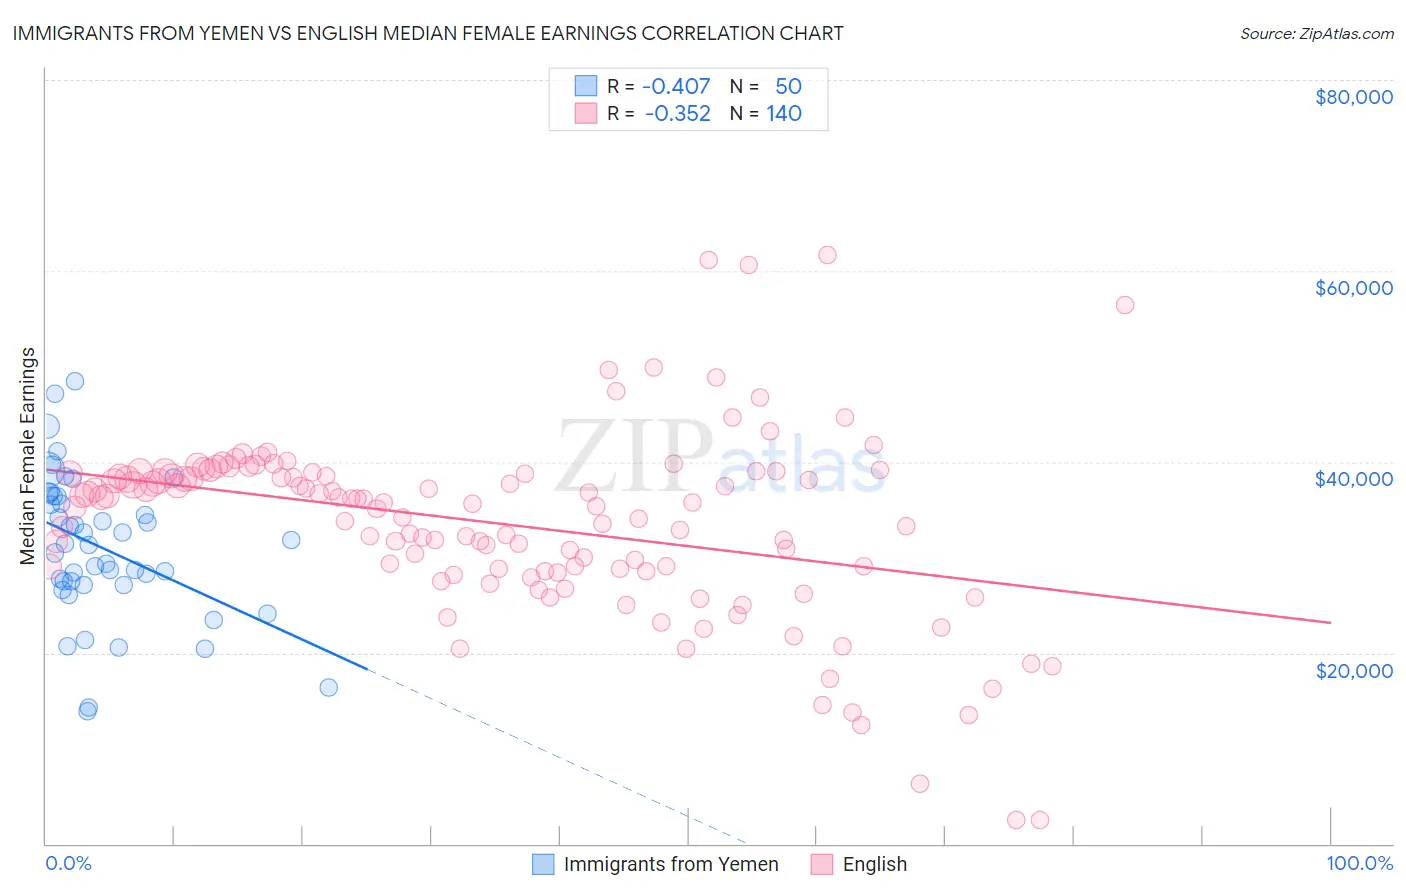
Immigrants from Yemen vs English Median Female Earnings Correlation Chart
The statistical analysis conducted on geographies consisting of 82,432,981 people shows a moderate negative correlation between the proportion of Immigrants from Yemen and median female earnings in the United States with a correlation coefficient (R) of -0.407 and weighted average of $34,693. Similarly, the statistical analysis conducted on geographies consisting of 577,154,042 people shows a mild negative correlation between the proportion of English and median female earnings in the United States with a correlation coefficient (R) of -0.352 and weighted average of $38,196, a difference of 10.1%.
Median Female Earnings Correlation Summary
| Measurement | Immigrants from Yemen | English |
| Minimum | $13,870 | $2,499 |
| Maximum | $48,438 | $61,721 |
| Range | $34,568 | $59,222 |
| Mean | $31,009 | $33,482 |
| Median | $31,316 | $35,643 |
| Interquartile 25% (IQ1) | $27,156 | $28,708 |
| Interquartile 75% (IQ3) | $36,449 | $38,774 |
| Interquartile Range (IQR) | $9,293 | $10,066 |
| Standard Deviation (Sample) | $7,583 | $9,710 |
| Standard Deviation (Population) | $7,507 | $9,675 |
Similar Demographics by Median Female Earnings
Demographics Similar to Immigrants from Yemen by Median Female Earnings
In terms of median female earnings, the demographic groups most similar to Immigrants from Yemen are Shoshone ($34,677, a difference of 0.050%), Potawatomi ($34,739, a difference of 0.13%), Immigrants from Honduras ($34,647, a difference of 0.13%), Cherokee ($34,742, a difference of 0.14%), and Pennsylvania German ($34,802, a difference of 0.31%).
| Demographics | Rating | Rank | Median Female Earnings |
| Ute | 0.0 /100 | #311 | Tragic $34,960 |
| Yaqui | 0.0 /100 | #312 | Tragic $34,943 |
| Cubans | 0.0 /100 | #313 | Tragic $34,942 |
| Apache | 0.0 /100 | #314 | Tragic $34,895 |
| Pennsylvania Germans | 0.0 /100 | #315 | Tragic $34,802 |
| Cherokee | 0.0 /100 | #316 | Tragic $34,742 |
| Potawatomi | 0.0 /100 | #317 | Tragic $34,739 |
| Immigrants | Yemen | 0.0 /100 | #318 | Tragic $34,693 |
| Shoshone | 0.0 /100 | #319 | Tragic $34,677 |
| Immigrants | Honduras | 0.0 /100 | #320 | Tragic $34,647 |
| Hispanics or Latinos | 0.0 /100 | #321 | Tragic $34,421 |
| Chickasaw | 0.0 /100 | #322 | Tragic $34,414 |
| Seminole | 0.0 /100 | #323 | Tragic $34,385 |
| Immigrants | Congo | 0.0 /100 | #324 | Tragic $34,317 |
| Dutch West Indians | 0.0 /100 | #325 | Tragic $34,106 |
Demographics Similar to English by Median Female Earnings
In terms of median female earnings, the demographic groups most similar to English are Alaska Native ($38,202, a difference of 0.020%), Immigrants from Cabo Verde ($38,208, a difference of 0.030%), Sudanese ($38,215, a difference of 0.050%), Liberian ($38,215, a difference of 0.050%), and Finnish ($38,173, a difference of 0.060%).
| Demographics | Rating | Rank | Median Female Earnings |
| Scandinavians | 5.2 /100 | #232 | Tragic $38,306 |
| Tongans | 5.1 /100 | #233 | Tragic $38,288 |
| Celtics | 5.0 /100 | #234 | Tragic $38,283 |
| Sudanese | 4.4 /100 | #235 | Tragic $38,215 |
| Liberians | 4.4 /100 | #236 | Tragic $38,215 |
| Immigrants | Cabo Verde | 4.3 /100 | #237 | Tragic $38,208 |
| Alaska Natives | 4.3 /100 | #238 | Tragic $38,202 |
| English | 4.2 /100 | #239 | Tragic $38,196 |
| Finns | 4.0 /100 | #240 | Tragic $38,173 |
| Spanish | 3.5 /100 | #241 | Tragic $38,098 |
| Immigrants | Burma/Myanmar | 3.0 /100 | #242 | Tragic $38,028 |
| Germans | 2.8 /100 | #243 | Tragic $37,986 |
| Immigrants | Liberia | 2.7 /100 | #244 | Tragic $37,970 |
| Immigrants | Middle Africa | 2.7 /100 | #245 | Tragic $37,965 |
| Delaware | 2.6 /100 | #246 | Tragic $37,964 |