Sudanese vs Portuguese Median Female Earnings
COMPARE
Sudanese
Portuguese
Median Female Earnings
Median Female Earnings Comparison
Sudanese
Portuguese
$38,215
MEDIAN FEMALE EARNINGS
4.4/ 100
METRIC RATING
235th/ 347
METRIC RANK
$40,177
MEDIAN FEMALE EARNINGS
73.0/ 100
METRIC RATING
157th/ 347
METRIC RANK
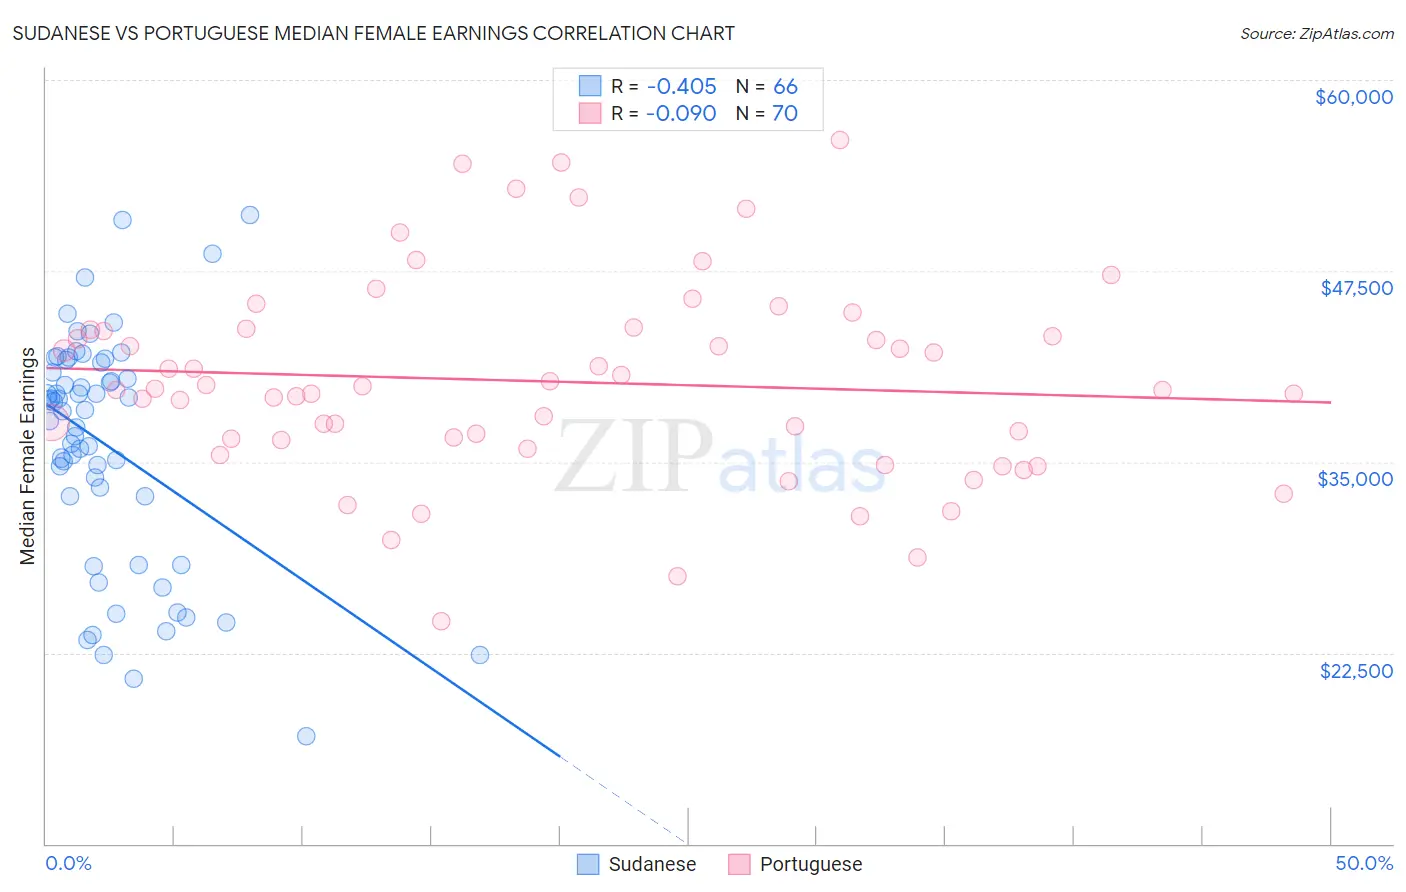
Sudanese vs Portuguese Median Female Earnings Correlation Chart
The statistical analysis conducted on geographies consisting of 110,138,863 people shows a moderate negative correlation between the proportion of Sudanese and median female earnings in the United States with a correlation coefficient (R) of -0.405 and weighted average of $38,215. Similarly, the statistical analysis conducted on geographies consisting of 449,940,574 people shows a slight negative correlation between the proportion of Portuguese and median female earnings in the United States with a correlation coefficient (R) of -0.090 and weighted average of $40,177, a difference of 5.1%.
Median Female Earnings Correlation Summary
| Measurement | Sudanese | Portuguese |
| Minimum | $17,051 | $24,606 |
| Maximum | $51,172 | $56,053 |
| Range | $34,121 | $31,447 |
| Mean | $36,010 | $40,249 |
| Median | $38,359 | $39,749 |
| Interquartile 25% (IQ1) | $32,734 | $36,452 |
| Interquartile 75% (IQ3) | $41,525 | $43,632 |
| Interquartile Range (IQR) | $8,791 | $7,179 |
| Standard Deviation (Sample) | $7,666 | $6,533 |
| Standard Deviation (Population) | $7,607 | $6,486 |
Similar Demographics by Median Female Earnings
Demographics Similar to Sudanese by Median Female Earnings
In terms of median female earnings, the demographic groups most similar to Sudanese are Liberian ($38,215, a difference of 0.0%), Immigrants from Cabo Verde ($38,208, a difference of 0.020%), Alaska Native ($38,202, a difference of 0.040%), English ($38,196, a difference of 0.050%), and Finnish ($38,173, a difference of 0.11%).
| Demographics | Rating | Rank | Median Female Earnings |
| Sub-Saharan Africans | 6.2 /100 | #228 | Tragic $38,391 |
| Belgians | 6.1 /100 | #229 | Tragic $38,382 |
| Basques | 5.7 /100 | #230 | Tragic $38,352 |
| Somalis | 5.5 /100 | #231 | Tragic $38,333 |
| Scandinavians | 5.2 /100 | #232 | Tragic $38,306 |
| Tongans | 5.1 /100 | #233 | Tragic $38,288 |
| Celtics | 5.0 /100 | #234 | Tragic $38,283 |
| Sudanese | 4.4 /100 | #235 | Tragic $38,215 |
| Liberians | 4.4 /100 | #236 | Tragic $38,215 |
| Immigrants | Cabo Verde | 4.3 /100 | #237 | Tragic $38,208 |
| Alaska Natives | 4.3 /100 | #238 | Tragic $38,202 |
| English | 4.2 /100 | #239 | Tragic $38,196 |
| Finns | 4.0 /100 | #240 | Tragic $38,173 |
| Spanish | 3.5 /100 | #241 | Tragic $38,098 |
| Immigrants | Burma/Myanmar | 3.0 /100 | #242 | Tragic $38,028 |
Demographics Similar to Portuguese by Median Female Earnings
In terms of median female earnings, the demographic groups most similar to Portuguese are Immigrants from Senegal ($40,157, a difference of 0.050%), Immigrants from Vietnam ($40,153, a difference of 0.060%), Peruvian ($40,234, a difference of 0.14%), Immigrants from Africa ($40,257, a difference of 0.20%), and Inupiat ($40,080, a difference of 0.24%).
| Demographics | Rating | Rank | Median Female Earnings |
| Immigrants | Chile | 79.6 /100 | #150 | Good $40,353 |
| Immigrants | Armenia | 79.2 /100 | #151 | Good $40,340 |
| West Indians | 78.4 /100 | #152 | Good $40,317 |
| British West Indians | 77.7 /100 | #153 | Good $40,299 |
| Immigrants | Oceania | 77.6 /100 | #154 | Good $40,297 |
| Immigrants | Africa | 76.2 /100 | #155 | Good $40,257 |
| Peruvians | 75.3 /100 | #156 | Good $40,234 |
| Portuguese | 73.0 /100 | #157 | Good $40,177 |
| Immigrants | Senegal | 72.2 /100 | #158 | Good $40,157 |
| Immigrants | Vietnam | 72.0 /100 | #159 | Good $40,153 |
| Inupiat | 68.9 /100 | #160 | Good $40,080 |
| Alsatians | 68.0 /100 | #161 | Good $40,060 |
| South American Indians | 66.1 /100 | #162 | Good $40,019 |
| Lebanese | 65.5 /100 | #163 | Good $40,006 |
| Immigrants | Saudi Arabia | 62.9 /100 | #164 | Good $39,952 |