Immigrants from Cuba vs English Median Female Earnings
COMPARE
Immigrants from Cuba
English
Median Female Earnings
Median Female Earnings Comparison
Immigrants from Cuba
English
$33,291
MEDIAN FEMALE EARNINGS
0.0/ 100
METRIC RATING
338th/ 347
METRIC RANK
$38,196
MEDIAN FEMALE EARNINGS
4.2/ 100
METRIC RATING
239th/ 347
METRIC RANK
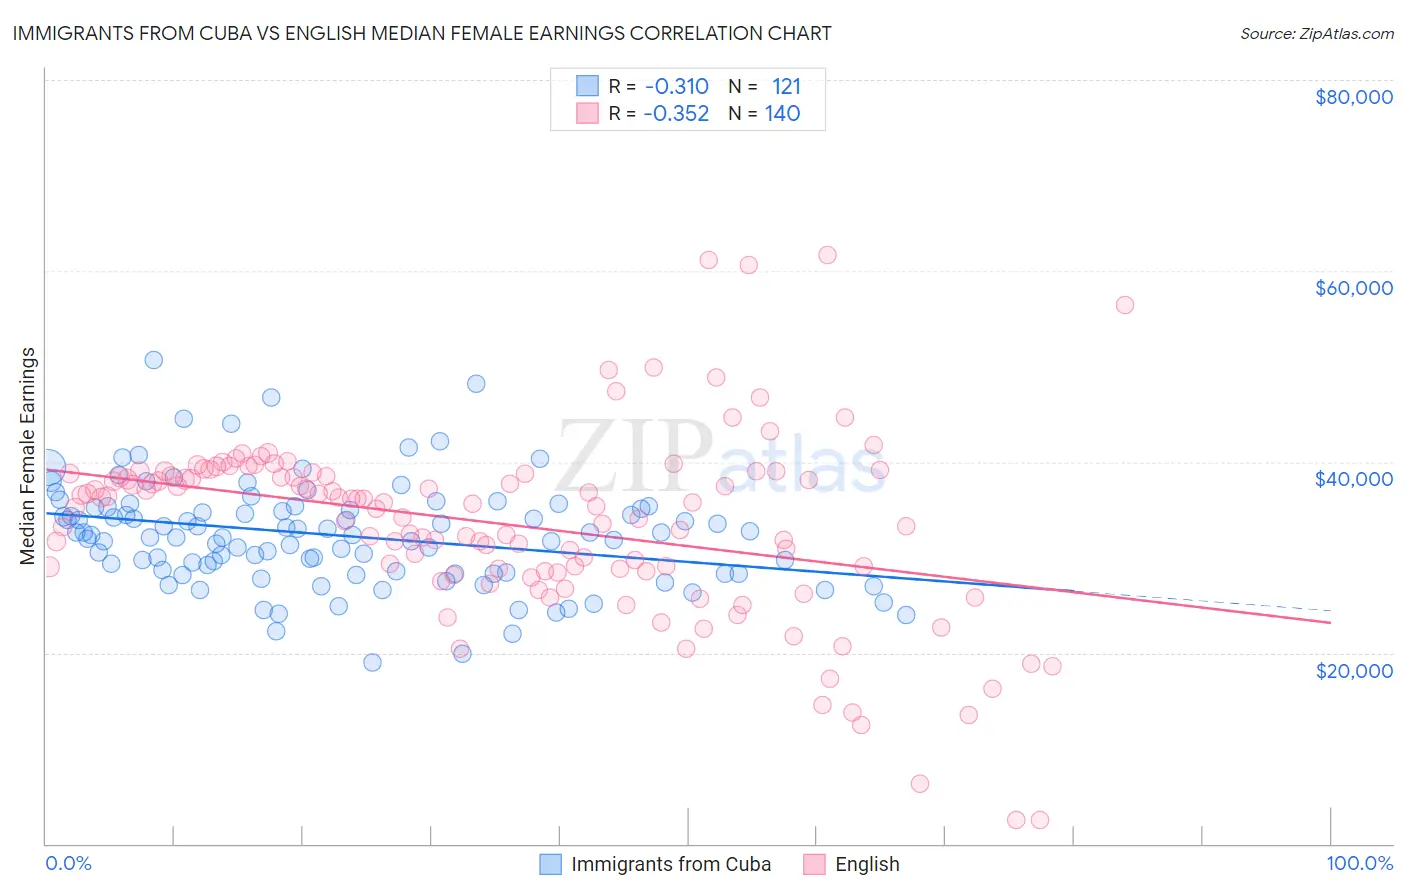
Immigrants from Cuba vs English Median Female Earnings Correlation Chart
The statistical analysis conducted on geographies consisting of 325,881,101 people shows a mild negative correlation between the proportion of Immigrants from Cuba and median female earnings in the United States with a correlation coefficient (R) of -0.310 and weighted average of $33,291. Similarly, the statistical analysis conducted on geographies consisting of 577,154,042 people shows a mild negative correlation between the proportion of English and median female earnings in the United States with a correlation coefficient (R) of -0.352 and weighted average of $38,196, a difference of 14.7%.
Median Female Earnings Correlation Summary
| Measurement | Immigrants from Cuba | English |
| Minimum | $18,945 | $2,499 |
| Maximum | $50,658 | $61,721 |
| Range | $31,713 | $59,222 |
| Mean | $32,289 | $33,482 |
| Median | $32,306 | $35,643 |
| Interquartile 25% (IQ1) | $28,389 | $28,708 |
| Interquartile 75% (IQ3) | $35,158 | $38,774 |
| Interquartile Range (IQR) | $6,769 | $10,066 |
| Standard Deviation (Sample) | $5,505 | $9,710 |
| Standard Deviation (Population) | $5,482 | $9,675 |
Similar Demographics by Median Female Earnings
Demographics Similar to Immigrants from Cuba by Median Female Earnings
In terms of median female earnings, the demographic groups most similar to Immigrants from Cuba are Immigrants from Mexico ($33,236, a difference of 0.17%), Yakama ($33,354, a difference of 0.19%), Ottawa ($33,378, a difference of 0.26%), Tohono O'odham ($33,205, a difference of 0.26%), and Creek ($33,437, a difference of 0.44%).
| Demographics | Rating | Rank | Median Female Earnings |
| Natives/Alaskans | 0.0 /100 | #331 | Tragic $33,806 |
| Choctaw | 0.0 /100 | #332 | Tragic $33,775 |
| Mexicans | 0.0 /100 | #333 | Tragic $33,664 |
| Spanish American Indians | 0.0 /100 | #334 | Tragic $33,625 |
| Creek | 0.0 /100 | #335 | Tragic $33,437 |
| Ottawa | 0.0 /100 | #336 | Tragic $33,378 |
| Yakama | 0.0 /100 | #337 | Tragic $33,354 |
| Immigrants | Cuba | 0.0 /100 | #338 | Tragic $33,291 |
| Immigrants | Mexico | 0.0 /100 | #339 | Tragic $33,236 |
| Tohono O'odham | 0.0 /100 | #340 | Tragic $33,205 |
| Navajo | 0.0 /100 | #341 | Tragic $33,046 |
| Yup'ik | 0.0 /100 | #342 | Tragic $32,730 |
| Pueblo | 0.0 /100 | #343 | Tragic $32,564 |
| Lumbee | 0.0 /100 | #344 | Tragic $32,500 |
| Puerto Ricans | 0.0 /100 | #345 | Tragic $31,560 |
Demographics Similar to English by Median Female Earnings
In terms of median female earnings, the demographic groups most similar to English are Alaska Native ($38,202, a difference of 0.020%), Immigrants from Cabo Verde ($38,208, a difference of 0.030%), Sudanese ($38,215, a difference of 0.050%), Liberian ($38,215, a difference of 0.050%), and Finnish ($38,173, a difference of 0.060%).
| Demographics | Rating | Rank | Median Female Earnings |
| Scandinavians | 5.2 /100 | #232 | Tragic $38,306 |
| Tongans | 5.1 /100 | #233 | Tragic $38,288 |
| Celtics | 5.0 /100 | #234 | Tragic $38,283 |
| Sudanese | 4.4 /100 | #235 | Tragic $38,215 |
| Liberians | 4.4 /100 | #236 | Tragic $38,215 |
| Immigrants | Cabo Verde | 4.3 /100 | #237 | Tragic $38,208 |
| Alaska Natives | 4.3 /100 | #238 | Tragic $38,202 |
| English | 4.2 /100 | #239 | Tragic $38,196 |
| Finns | 4.0 /100 | #240 | Tragic $38,173 |
| Spanish | 3.5 /100 | #241 | Tragic $38,098 |
| Immigrants | Burma/Myanmar | 3.0 /100 | #242 | Tragic $38,028 |
| Germans | 2.8 /100 | #243 | Tragic $37,986 |
| Immigrants | Liberia | 2.7 /100 | #244 | Tragic $37,970 |
| Immigrants | Middle Africa | 2.7 /100 | #245 | Tragic $37,965 |
| Delaware | 2.6 /100 | #246 | Tragic $37,964 |